Research and Background
What mean reversion is (and what it isn’t)
Mean Reversion is the simple idea that the price of an asset over a chosen horizon often fluctuates around a reference level that could be a long term average, fair value or market “consensus” level. When price moves unusually far away from that level, it can drift back to that level as the temporary forces that pushed it away fade.
Two clarifications are required.
First, mean reversion is horizon dependent. A stock can trend for months and still mean‑revert over days or vice-versa. The concept is not “price must revert” but rather given a horizon and context extreme deviation have a higher probability of a reversion than a random walk
Second, mean reversion is not a promise of “fair value.” Many short‑term deviations are driven by temporary pressure: forced flows, liquidity gaps, short‑term positioning, or behavioural overreaction. When that pressure relaxes, the market can retrace part of the move even without any change in fundamentals.
This is why systematic mean‑reversion research often begins with a simple question: do unusually large, short‑term moves tend to partially unwind?
Once that is established, we can move deeper.
What the data says: return reversals exist (especially at shorter horizons)
Again, do extreme short‑term moves tend to partially unwind?
Let’s look at some literature that talk about this with different angles
A couple of important studies found evidence that this does happen:
-
Jegadeesh (1990), “Evidence of Predictable Behavior of Security Returns” shows that at very short horizons, stock returns are not completely random — there are patterns where strong moves often get followed by partial reversals.
-
Lehmann (1990), “Fads, Martingales, and Market Efficiency” finds that short-term “contrarian” behaviour can work meaning that buying recent underperformers and selling recent outperformers (over very short windows) sometimes produces positive results.
At longer horizons, the same “overshoot then correction” theme shows up in a famous paper:
- De Bondt & Thaler (1985), “Does the Stock Market Overreact?” argues that investors often overreact to news, pushing prices too far away from normal levels — and over time, prices tend to drift back.
The important takeaway is this:
Mean reversion is not guaranteed every day. But the evidence suggests that reversal effects exist, and they are often strongest at shorter horizons, especially when moves are driven by temporary pressure rather than real fundamental repricing.
Why reversals can happen: overreaction and behavioural frictions
One explanation for mean reversion is behavioural. Participants tend to overweight recent information, exhibit herding behaviour, overrate trends because of this biases prices temporarily tend to move away from its “normal level”.
Again, De Bondt & Thaler (1985), “Does the Stock Market Overreact?” talks about investors always being irrational which pushes prices to unjustifiable levels creating conditions for a snapback
A microstructure lens: liquidity shocks and temporary price pressure
Mean reversion also has an non-behavioural explanation: short term and liquidity moves.
Sometimes prices do not move because of new information, but simply because someone wants to sell urgently. There are not enough buyers at the current price so the seller sells at lower bids which pushes the prices down. But eventually normal buyers return, liquidity improves and price could revert.
This is the intuition behind Grossman & Miller (1988), “Liquidity and Market Structure”: liquidity providers step in when prices get temporarily pushed away from normal levels, which helps pull prices back.
When mean reversion breaks: regimes, trends, and structural information
Mean reversion works best when markets normal i.e. doing its normal “back and forth” movement. But it breaks when the market actually reprices.
When something major changes for example earnings shock, policy change, macro news etc what looks like an over-stretch can actually be the new trend of the market.
So the key idea is:
Mean reversion is conditional. It’s not a law of markets.
It works more reliably when the market is “balanced,” and it fails when the market is “one-sided” or repricing due to real information.
From idea to signal: envelopes, normalisation, and statistical hygiene
To trade mean reversion systematically, context should be given as “distance from normal”.
Creating bands, envelopes around a reference mean are used widely.
Finally, mean reversion is particularly easy to over‑tune (“this band width worked best in-sample”). Research on data‑snooping and multiple testing—such as Sullivan, Timmermann & White (1999), “Data‑Snooping, Technical Trading Rule Performance, and the Bootstrap” and White (2000), “A Reality Check for Data Snooping”—formalises why a strategy can look excellent simply because many variations were tried.
Strategy construction
In this section we describe how we’ve built a systematic envelope‑based mean reversion strategy around the ideas above.
Universe and data
The strategy is designed for a broad liquid NSE equity universe, focusing on names with sufficient volume
Signal intuition: buy statistically stretched pullbacks in healthier conditions
At the core is a simple idea: in broadly healthy conditions, short‑term pullbacks can overshoot, and a partial snapback can be harvested systematically.
We express “overshoot” as a deviation below a short‑term reference mean using an envelope (a percentage band around a moving average). When price becomes sufficiently stretched below this reference, it becomes a candidate for mean‑reversion entry.
Because mean reversion can fail badly in persistent downtrends, the strategy includes a higher‑timeframe filter (a simple way to avoid fading markets that are structurally weak). Conceptually, the system prefers to trade mean reversion when the broader trend context is not hostile.
Execution logic and position management
The strategy runs on a repeatable daily workflow: it identifies candidates that meet the envelope‑stretch condition and then enters positions, with caps on how many names can be held at a time. Position sizing is kept systematic (so no single trade dominates the portfolio), and the overall design aims to capture snapbacks, not multi‑week trends.
Risk controls and exits
Mean‑reversion systems live or die on risk control. Our implementation uses Wizzer’s risk tooling to enforce disciplined exits, combining time‑based exits with price‑based stop/target logic.
Backtests
All backtests are implemented on Wizzer, mirroring live constraints as closely as possible.
We specifically ensure:
-
Point‑in‑time universe / membership: the strategy is tested on what was actually investable at each date (no survivorship shortcuts).
-
Corporate‑action adjusted series: prices reflect splits/bonuses/dividends where applicable.
-
Realistic execution assumptions: fees and transaction costs are included so results are not “paper perfect.”
Backtest logic mirrors the live workflow: signal formation, position caps, order timing, and exits follow the same rule structure used in deployment.
Outcomes
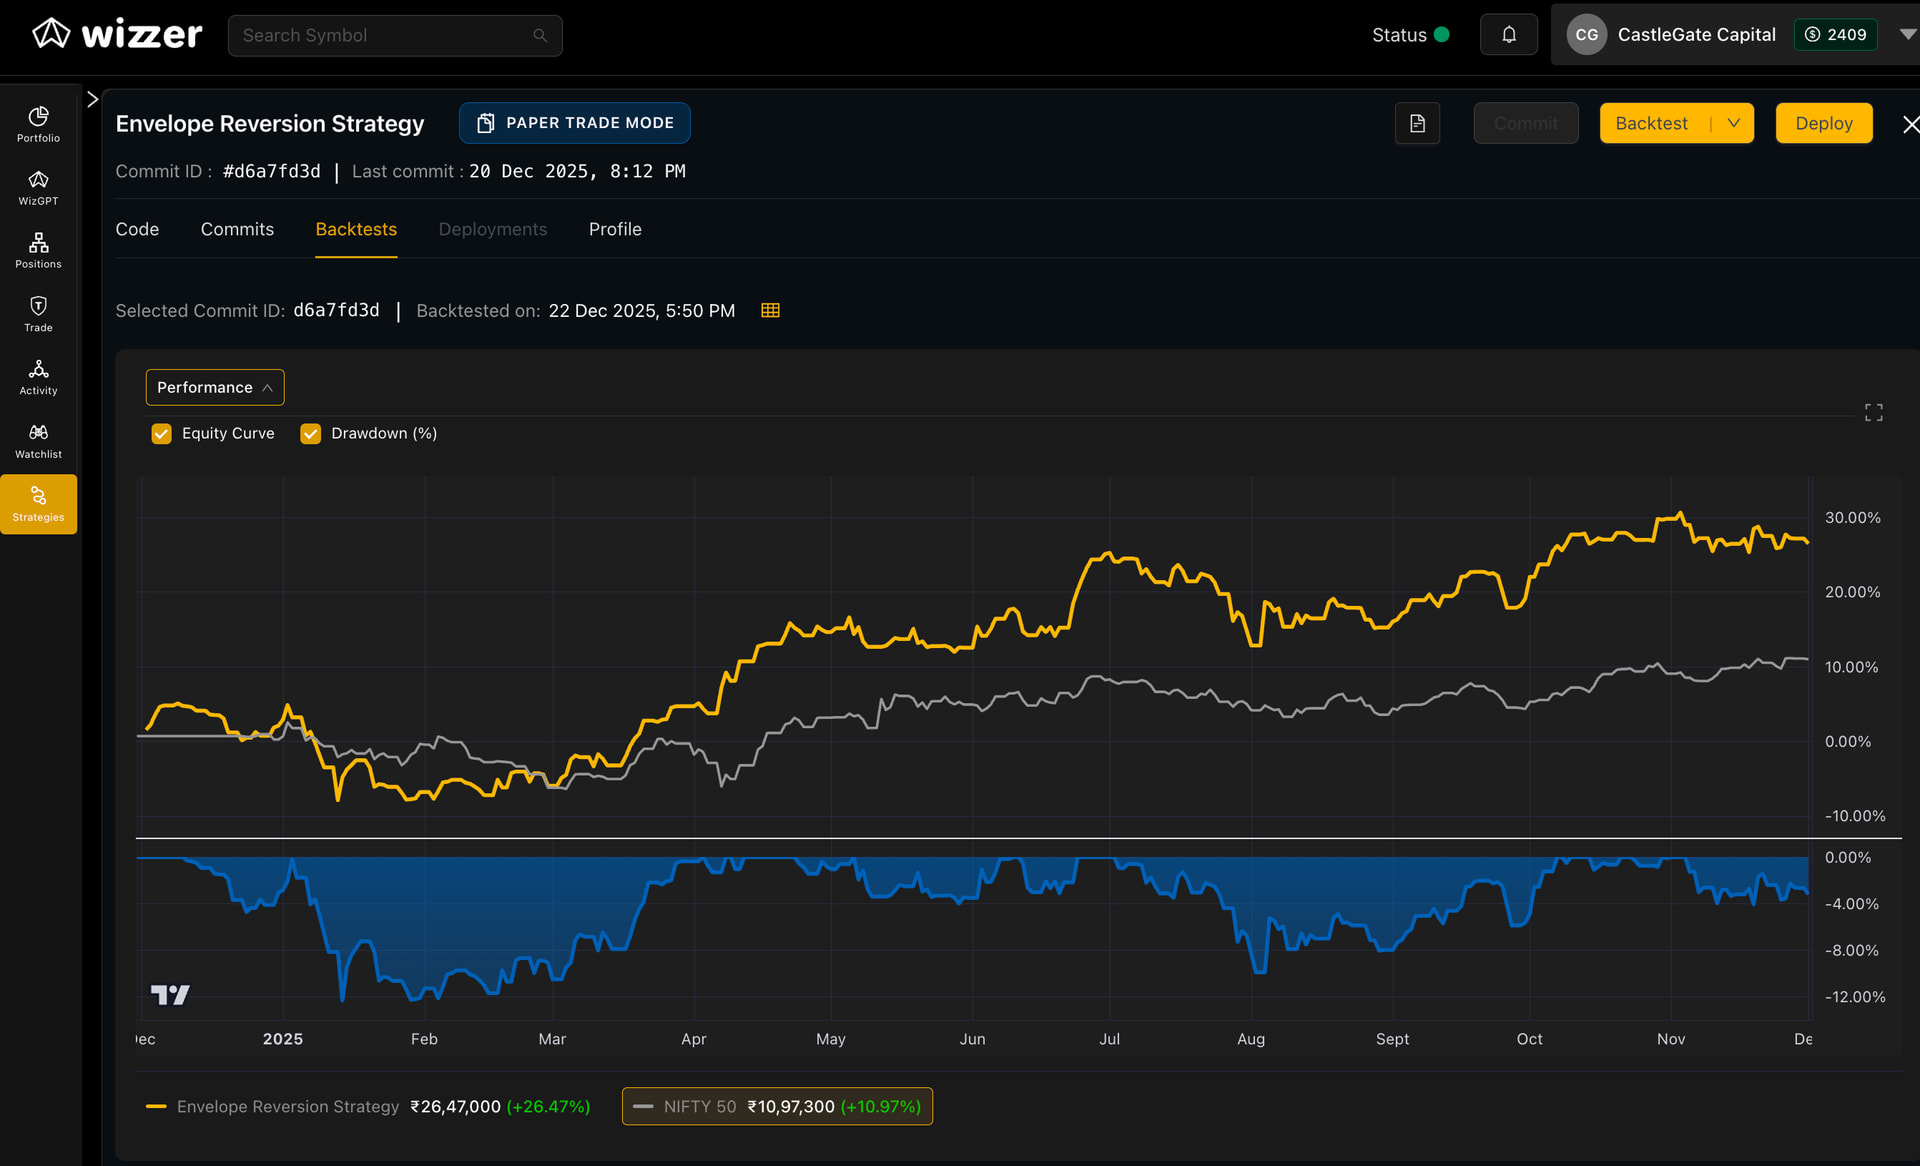
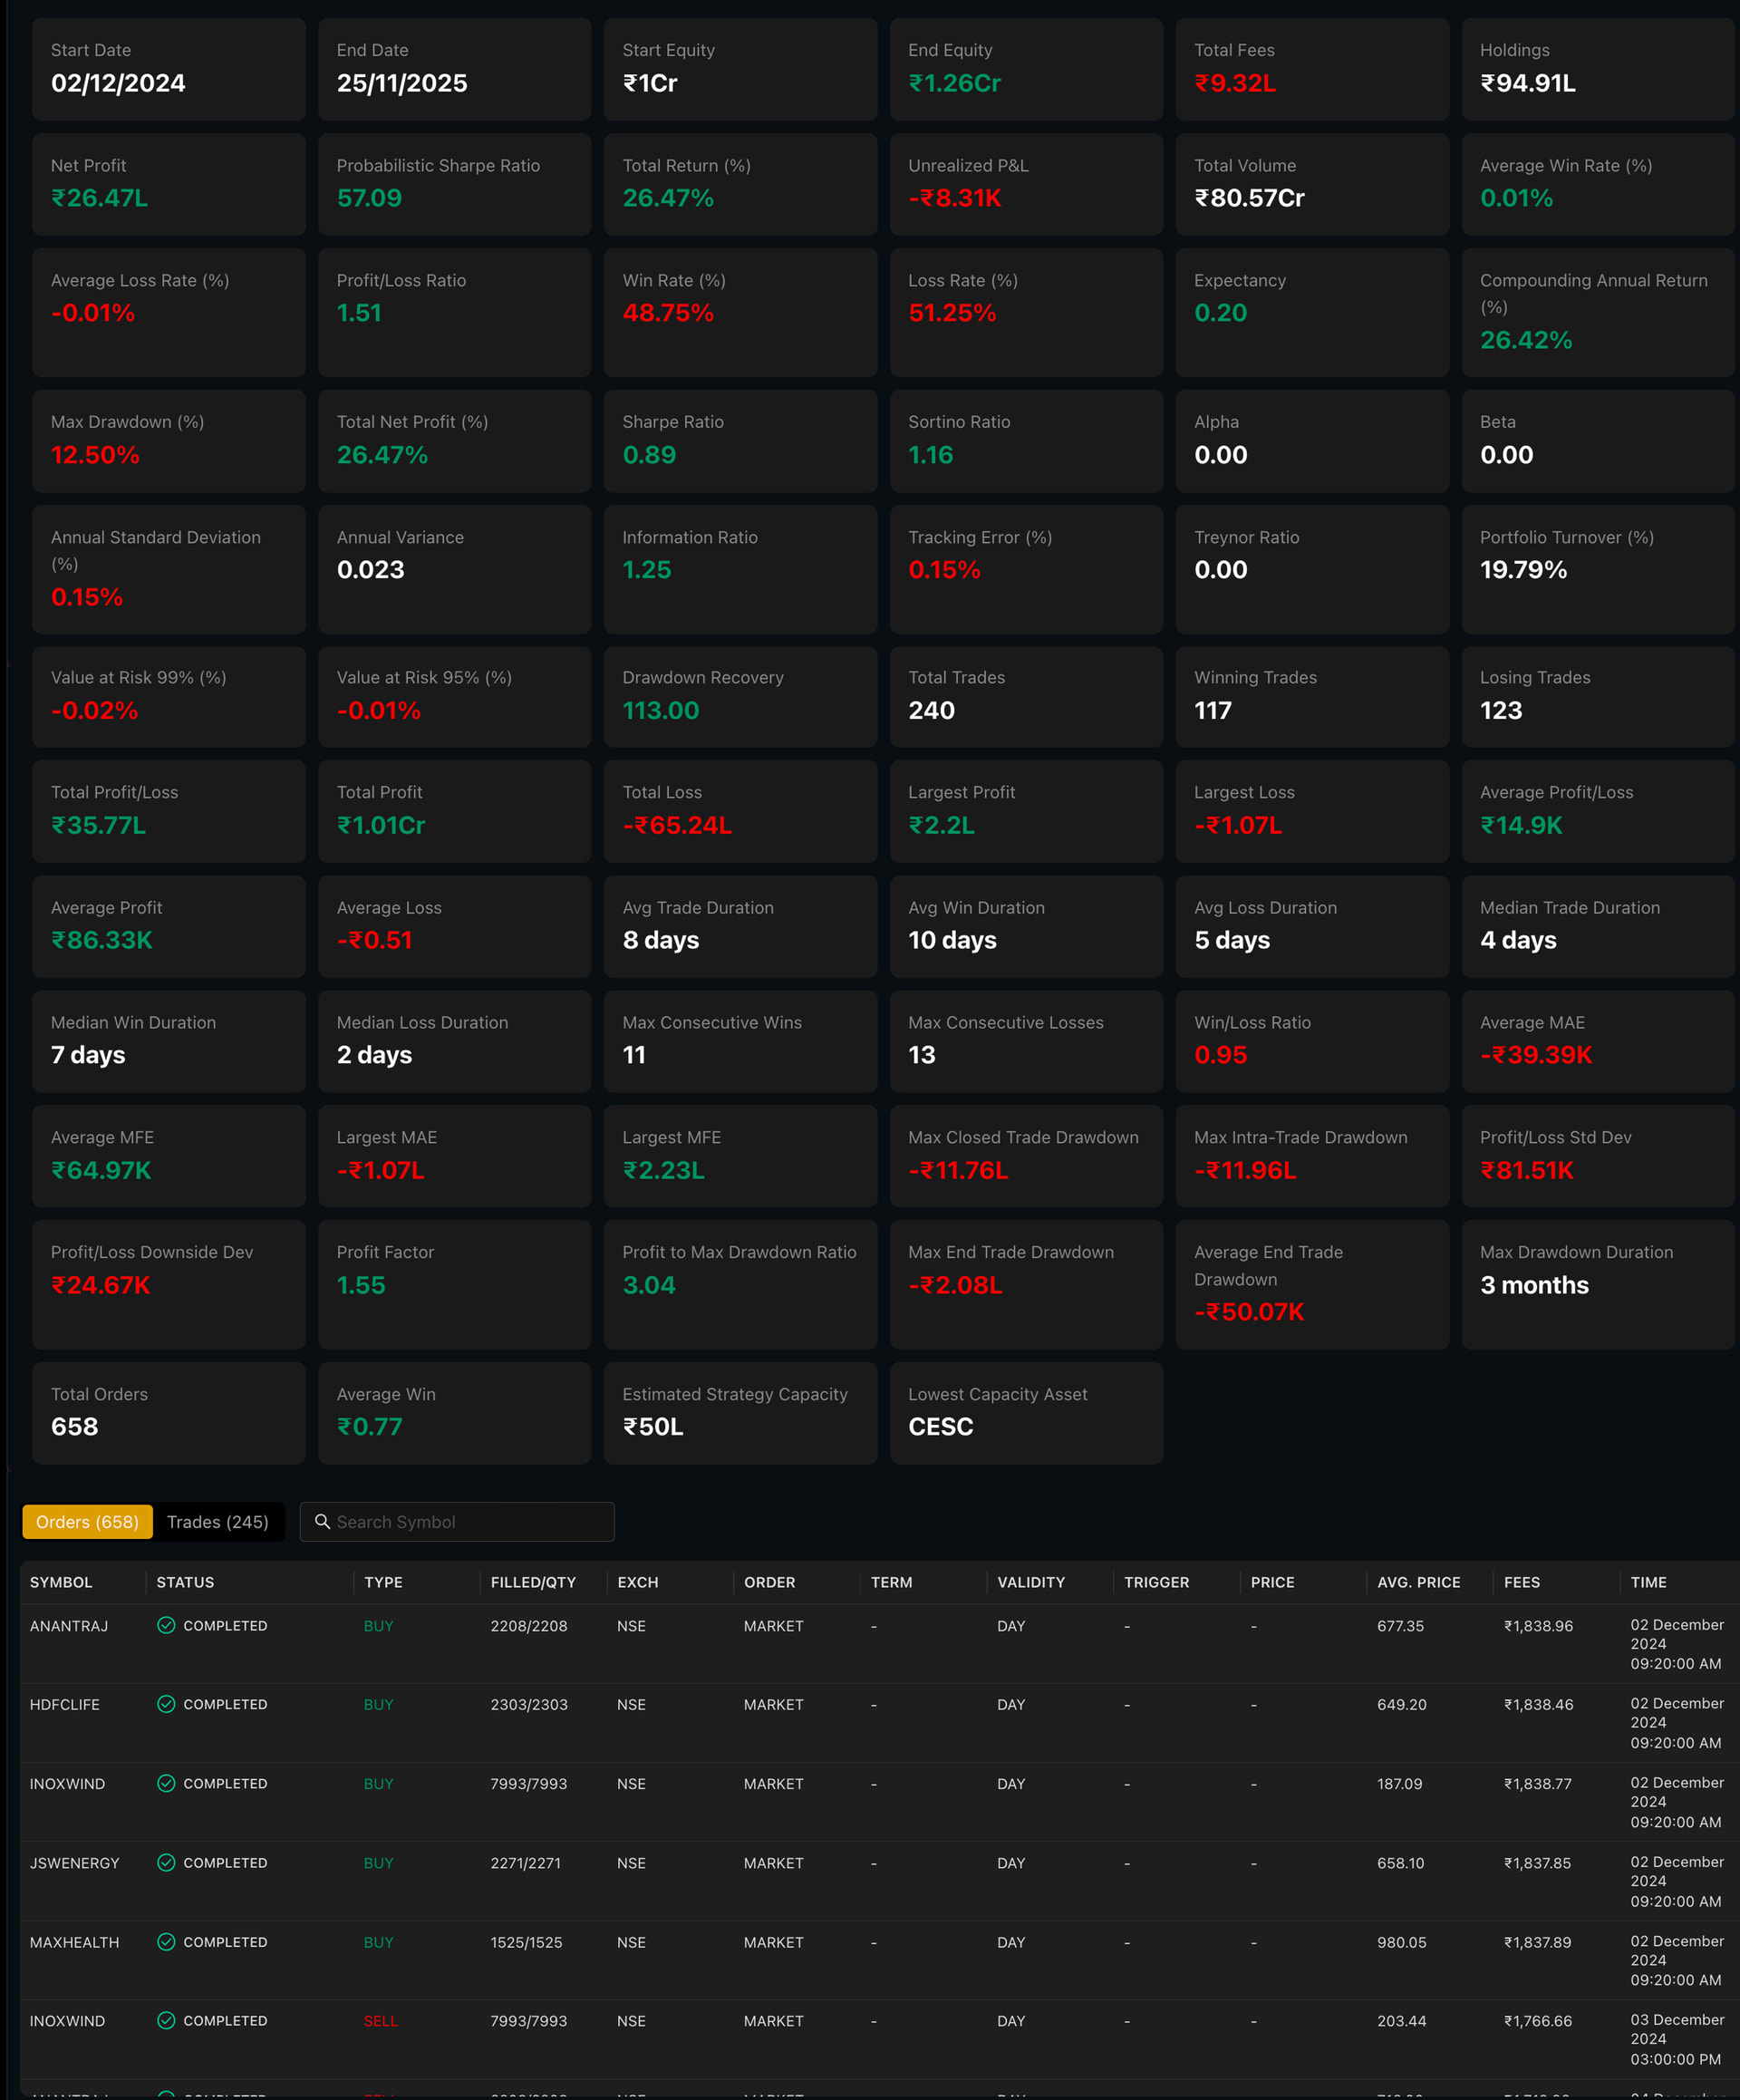
When backtested over a 1 year period, the strategy delivered a +26.47% total return, Over the same window, NIFTY 50 was up about +10.97%, so the strategy produced strong benchmark outperformance.
From a risk/quality lens, a few numbers stand out:
-
Compounding annual return ~26.42% with a max drawdown ~12.5% — a return profile that stayed relatively contained on the downside.
-
Profit-to-max-drawdown ratio ~3.04 and profit factor ~1.55, indicating that gains were meaningfully larger than losses over the run.
-
A relatively “clean” trade count (~240 trades) and portfolio turnover ~19.79%, consistent with a systematic swing-style mean‑reversion process rather than high-churn trading.
Overall, the key takeaway from this run is that the strategy combined meaningful absolute returns with clear benchmark outperformance, while keeping drawdowns within a manageable band for the period tested.
References
Our materials
-
Strategy Document
 Click to open
 -
Research Paper Pack (Folder)
Click to open
Contact us
If you’d like the full research pack, detailed backtest outputs, or a walkthrough of how we implement the Envelope Reversion Strategy systematically on Wizzer, reach us on WhatsApp:
+91-8928065586