1. Research and Background
1.1 From indicators to information: why breakouts are studied
Most “classic” indicators (moving averages, oscillators, channel breaks) are different ways of compressing one idea: markets sometimes move from balance → imbalance. A breakout framework tries to measure that transition directly.
In market-microstructure terms, prices move when order flow becomes one‑sided and liquidity is not sufficient to absorb it at the prior range. A breakout level is simply an objective reference point where we expect that imbalance to show up: the prior day’s high/low, a multi‑day extreme, a volatility band, or another well‑defined range boundary.
Academic work has long tested rule‑based “trend” and breakout‑type signals. For example, **Brock, Lakonishok & LeBaron (1992), **“Simple Technical Trading Rules and the Stochastic Properties of Stock Returns” tests two of the simplest families of rules—moving averages and trading‑range breaks (a close cousin of classic channel breakouts)—over a very long history of Dow data, using bootstrap methods to assess significance. Later, comprehensive surveys such as **Park & Irwin (2007), **“What Do We Know About the Profitability of Technical Analysis?” review decades of empirical studies and conclude that many technical strategies—including breakout and filter rules—show evidence of profitability across markets, while repeatedly stressing the same reality: results are highly sensitive to transaction costs, execution assumptions, and research design.
The practical takeaway: breakout trading is not “magic”—it’s a structured way of expressing a market hypothesis:
When price escapes a well‑defined range with genuine participation, the next path‑of‑least‑resistance is often continuation.
1.2 Breakouts as intraday momentum (and why short-horizon continuation can exist)
At intraday horizons, the most important question is whether price moves are random noise or whether there is short‑term persistence after information hits the tape.
A useful lens comes from research on intraday return patterns and short‑horizon continuation. **Heston, Korajczyk & Sadka (2010), **“Intraday Patterns in the Cross‑section of Stock Returns” documents persistent within‑day continuation patterns at specific time intervals (and shows that related intraday variables like volume and volatility exhibit structured behaviour as well). Separately, microstructure and order‑flow research such as **Hasbrouck (1991), **“Measuring the Information Content of Stock Trades” provides a mechanism: trades can carry information, and their impact can unfold through a sequence of quote revisions rather than a single instantaneous price jump.
Breakouts are one of the cleanest ways to operationalise this idea because they are event‑driven (a level is crossed) rather than purely “lookback driven” (a moving average crosses). Instead of asking “is the average trending?”, we ask:
-
Did price escape a meaningful boundary?
-
Was the escape accompanied by activity that suggests real participation?
-
Did the move show follow‑through rather than immediate failure?
1.3 Volatility expansion: why “range” and “ATR” ideas keep showing up
Breakouts are tightly linked to volatility. Many breakouts fail when volatility is too low (noise dominates), and many breakouts become dangerous when volatility is too high (whipsaws and gap risk dominate). This is why practitioners often anchor breakout thresholds to volatility-adjusted measures like ATR or realised volatility.
The academic foundation for this framing is the well‑documented structure of intraday volatility: volatility is typically elevated near the open and close, and volatility dynamics show clustering and regime shifts. Realised volatility work such as **Andersen, Bollerslev, Diebold & Labys (2001), **“The Distribution of Realized Exchange Rate Volatility”formalises how high‑frequency returns can be aggregated into model‑free volatility estimates, reinforcing that volatility is a state variable that changes through time (and therefore breakout thresholds should adapt, not remain fixed).
For intraday breakout systems, this motivates a simple principle:
A breakout threshold should scale with volatility, so that the strategy responds to “meaningful” moves rather than raw price points.
1.4 Volume and liquidity: filtering “real moves” from fragile moves
A breakout is more believable when it occurs with healthy participation and in instruments where price impact is not extreme.
Liquidity research shows why. **Amihud (2002), **“Illiquidity and Stock Returns: Cross‑Section and Time‑Series Effects” formalises an intuitive idea with a simple measure (often referred to as ILLIQ): the same percentage price move can mean very different things depending on how much volume it took to produce it. Microstructure work like **Hasbrouck (1991), **“Measuring the Information Content of Stock Trades” likewise emphasises that price changes reflect the interaction of trades and liquidity—so a breakout that clears a level with depth and participation is structurally different from a breakout that clears a level in thin conditions.
This is where volume‑surge filters in breakout systems come from: a move that clears a level and occurs on unusually strong volume is more likely to reflect meaningful demand/supply imbalance than a move that clears a level on thin activity.
1.5 Why statistics matters (especially for intraday strategies)
Intraday signals are powerful but noisy. That’s why the difference between a “good idea” and a tradeable system is often the statistical hygiene:
-
Normalisation: comparing moves across stocks requires volatility/ATR scaling.
-
Outlier control: intraday data has jumps, bad prints, and microstructure effects.
-
Avoiding false discoveries: when many variations are tested, some will look good by luck.
This problem is formalised in classic research on data‑snooping and model selection. **Sullivan, Timmermann & White (1999), **“Data‑Snooping, Technical Trading Rule Performance, and the Bootstrap” shows how easy it is to “discover” apparently profitable rules when many variations are tested. **White (2000), **“A Reality Check for Data Snooping”proposes a framework to correct for this best‑strategy bias, and **Hansen (2005), **“A Test for Superior Predictive Ability” strengthens the testing approach by improving power and reducing sensitivity to irrelevant alternatives. The implication is practical: intraday systems should be evaluated with realistic costs, robust sampling, and caution about over‑tuning—and the research process should explicitly account for how many ideas were tried along the way.
2. Strategy construction
In this section we describe how we’ve built a systematic intraday breakout strategy around these ideas, without disclosing every micro‑parameter.
2.1 Universe and intraday data
The strategy operates on a liquid equity universe using 1‑minute OHLCV data. The goal is to focus on instruments where intraday breakouts are implementable—i.e., sufficient liquidity, consistent trading, and stable corporate‑action adjusted price histories.
2.2 Breakout signal framework (volatility + participation)
At a high level, the signal engine looks for stocks that are primed for an intraday continuation move, and then triggers entries when a volatility‑adjusted breakout occurs. Breakout levels are not treated as “hard lines”; they are interpreted through a volatility lens so that the strategy reacts to moves that are meaningful for that stock in that regime.
To reduce false breakouts, the strategy adds a participation confirmation layer. Rather than taking every level break, it prefers breakouts that occur when activity is elevated versus the stock’s own recent history—an attempt to distinguish genuine demand/supply imbalance from noise.
2.3 Position management and re‑entries
Because intraday breakouts can trend and then pause, the strategy supports structured position management rather than a single all‑in/all‑out event. It enforces capital discipline (limits on simultaneous positions and repeated entries in the same name) and keeps the workflow systematic: entries, adds/re‑entries (when permitted), and reductions are all rule‑based.
2.4 Risk controls and intraday exits
Risk management is built around two principles: cut failures quickly and let valid breakouts breathe. Exits are volatility-aware (so stops and trails adapt to the stock’s movement), and profits can be harvested in a staged way to reduce regret while still allowing participation in extended trends.
Crucially, this is a strictly intraday system: positions are squared off by a fixed end‑of‑day cutoff, regardless of whether the signal remains valid.
3. Backtests
All backtests are implemented on Wizzer with realistic market constraints. We use point‑in‑time universes/index membership, corporate‑action adjusted price series (splits/bonuses/dividends where applicable), and intraday OHLCV built from the same data pipeline used for strategy execution.
To keep results grounded, the simulation includes transaction costs and trading fees, and the backtest logic mirrors live behavior: intraday entry windows, position limits, and mandatory square‑off at the end‑of‑day cutoff.
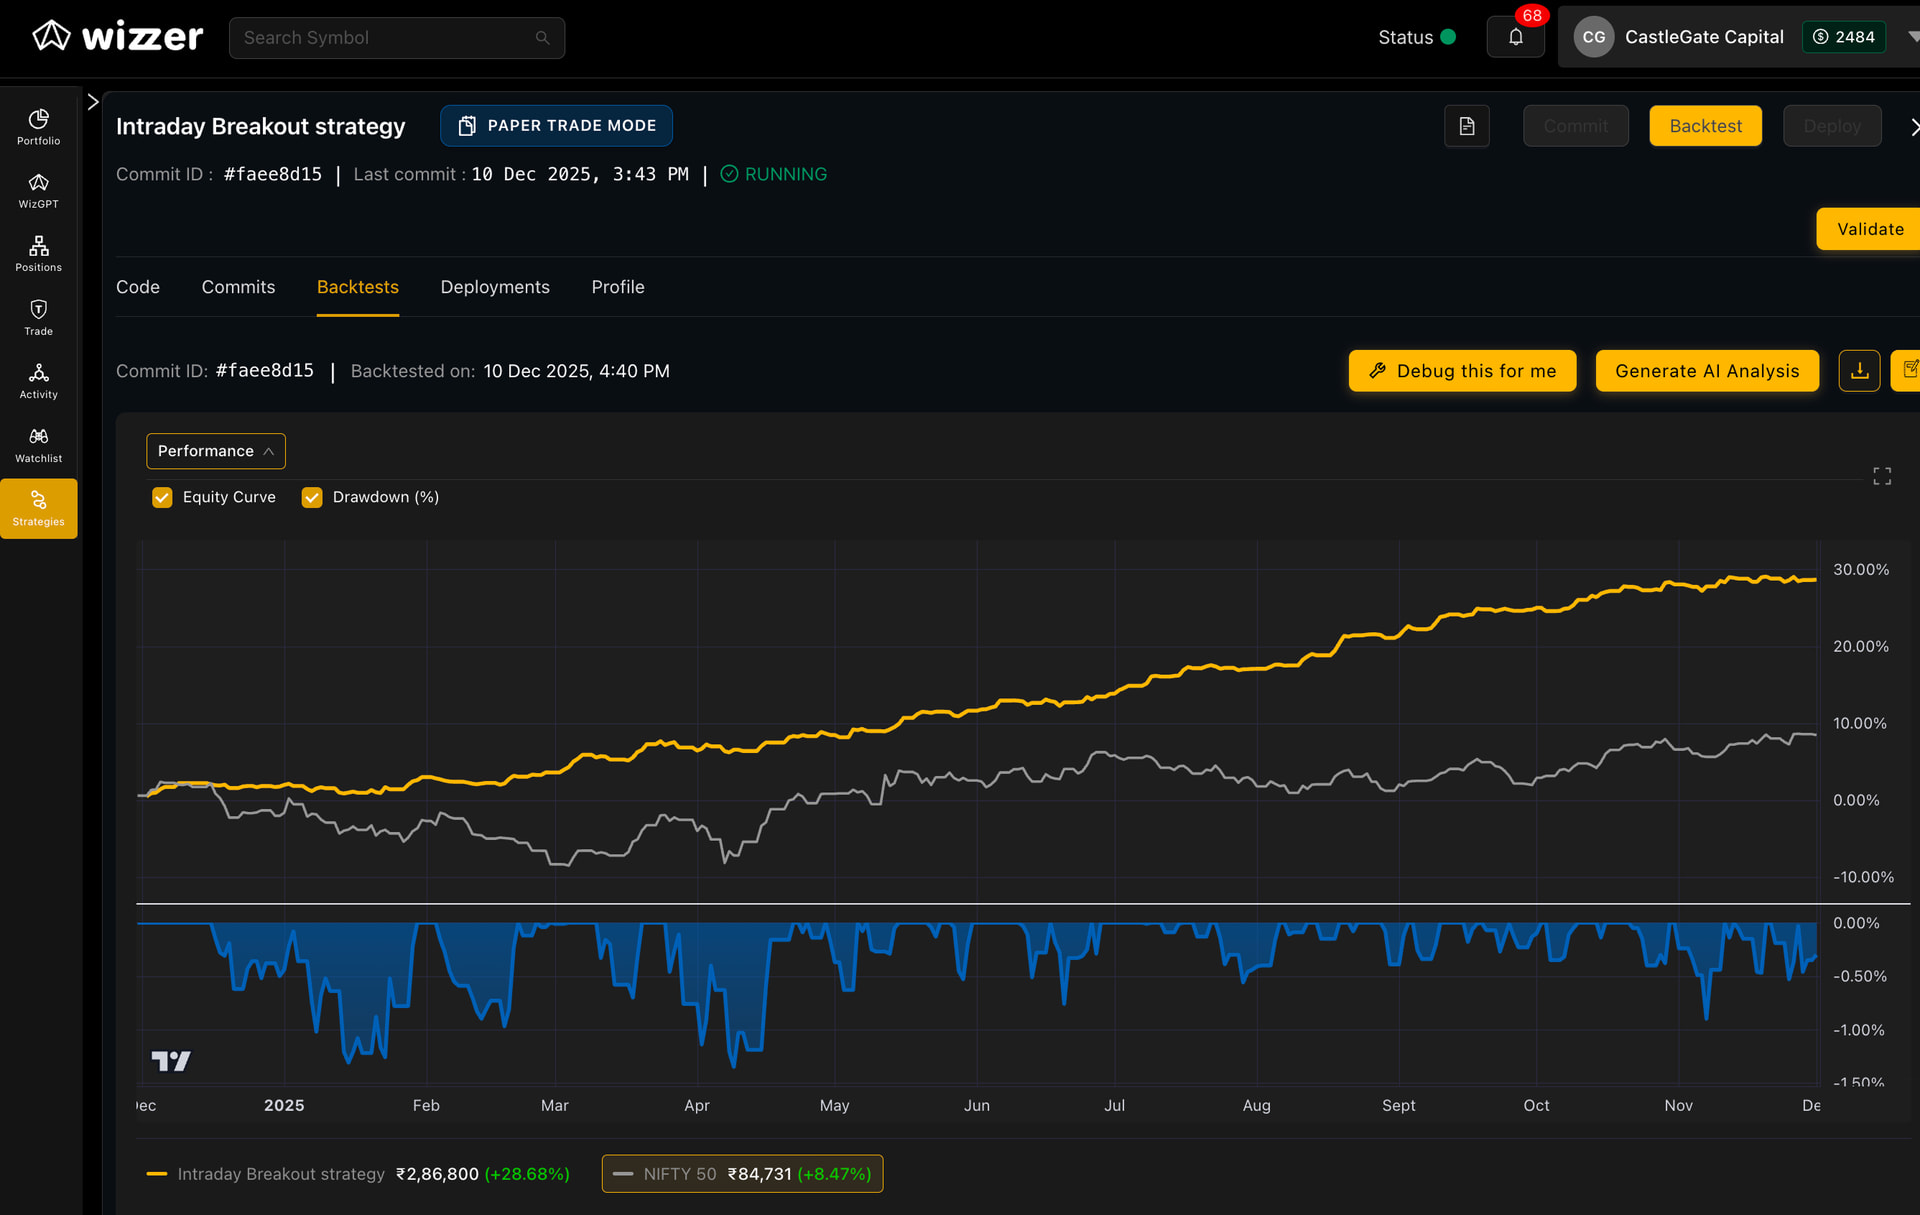
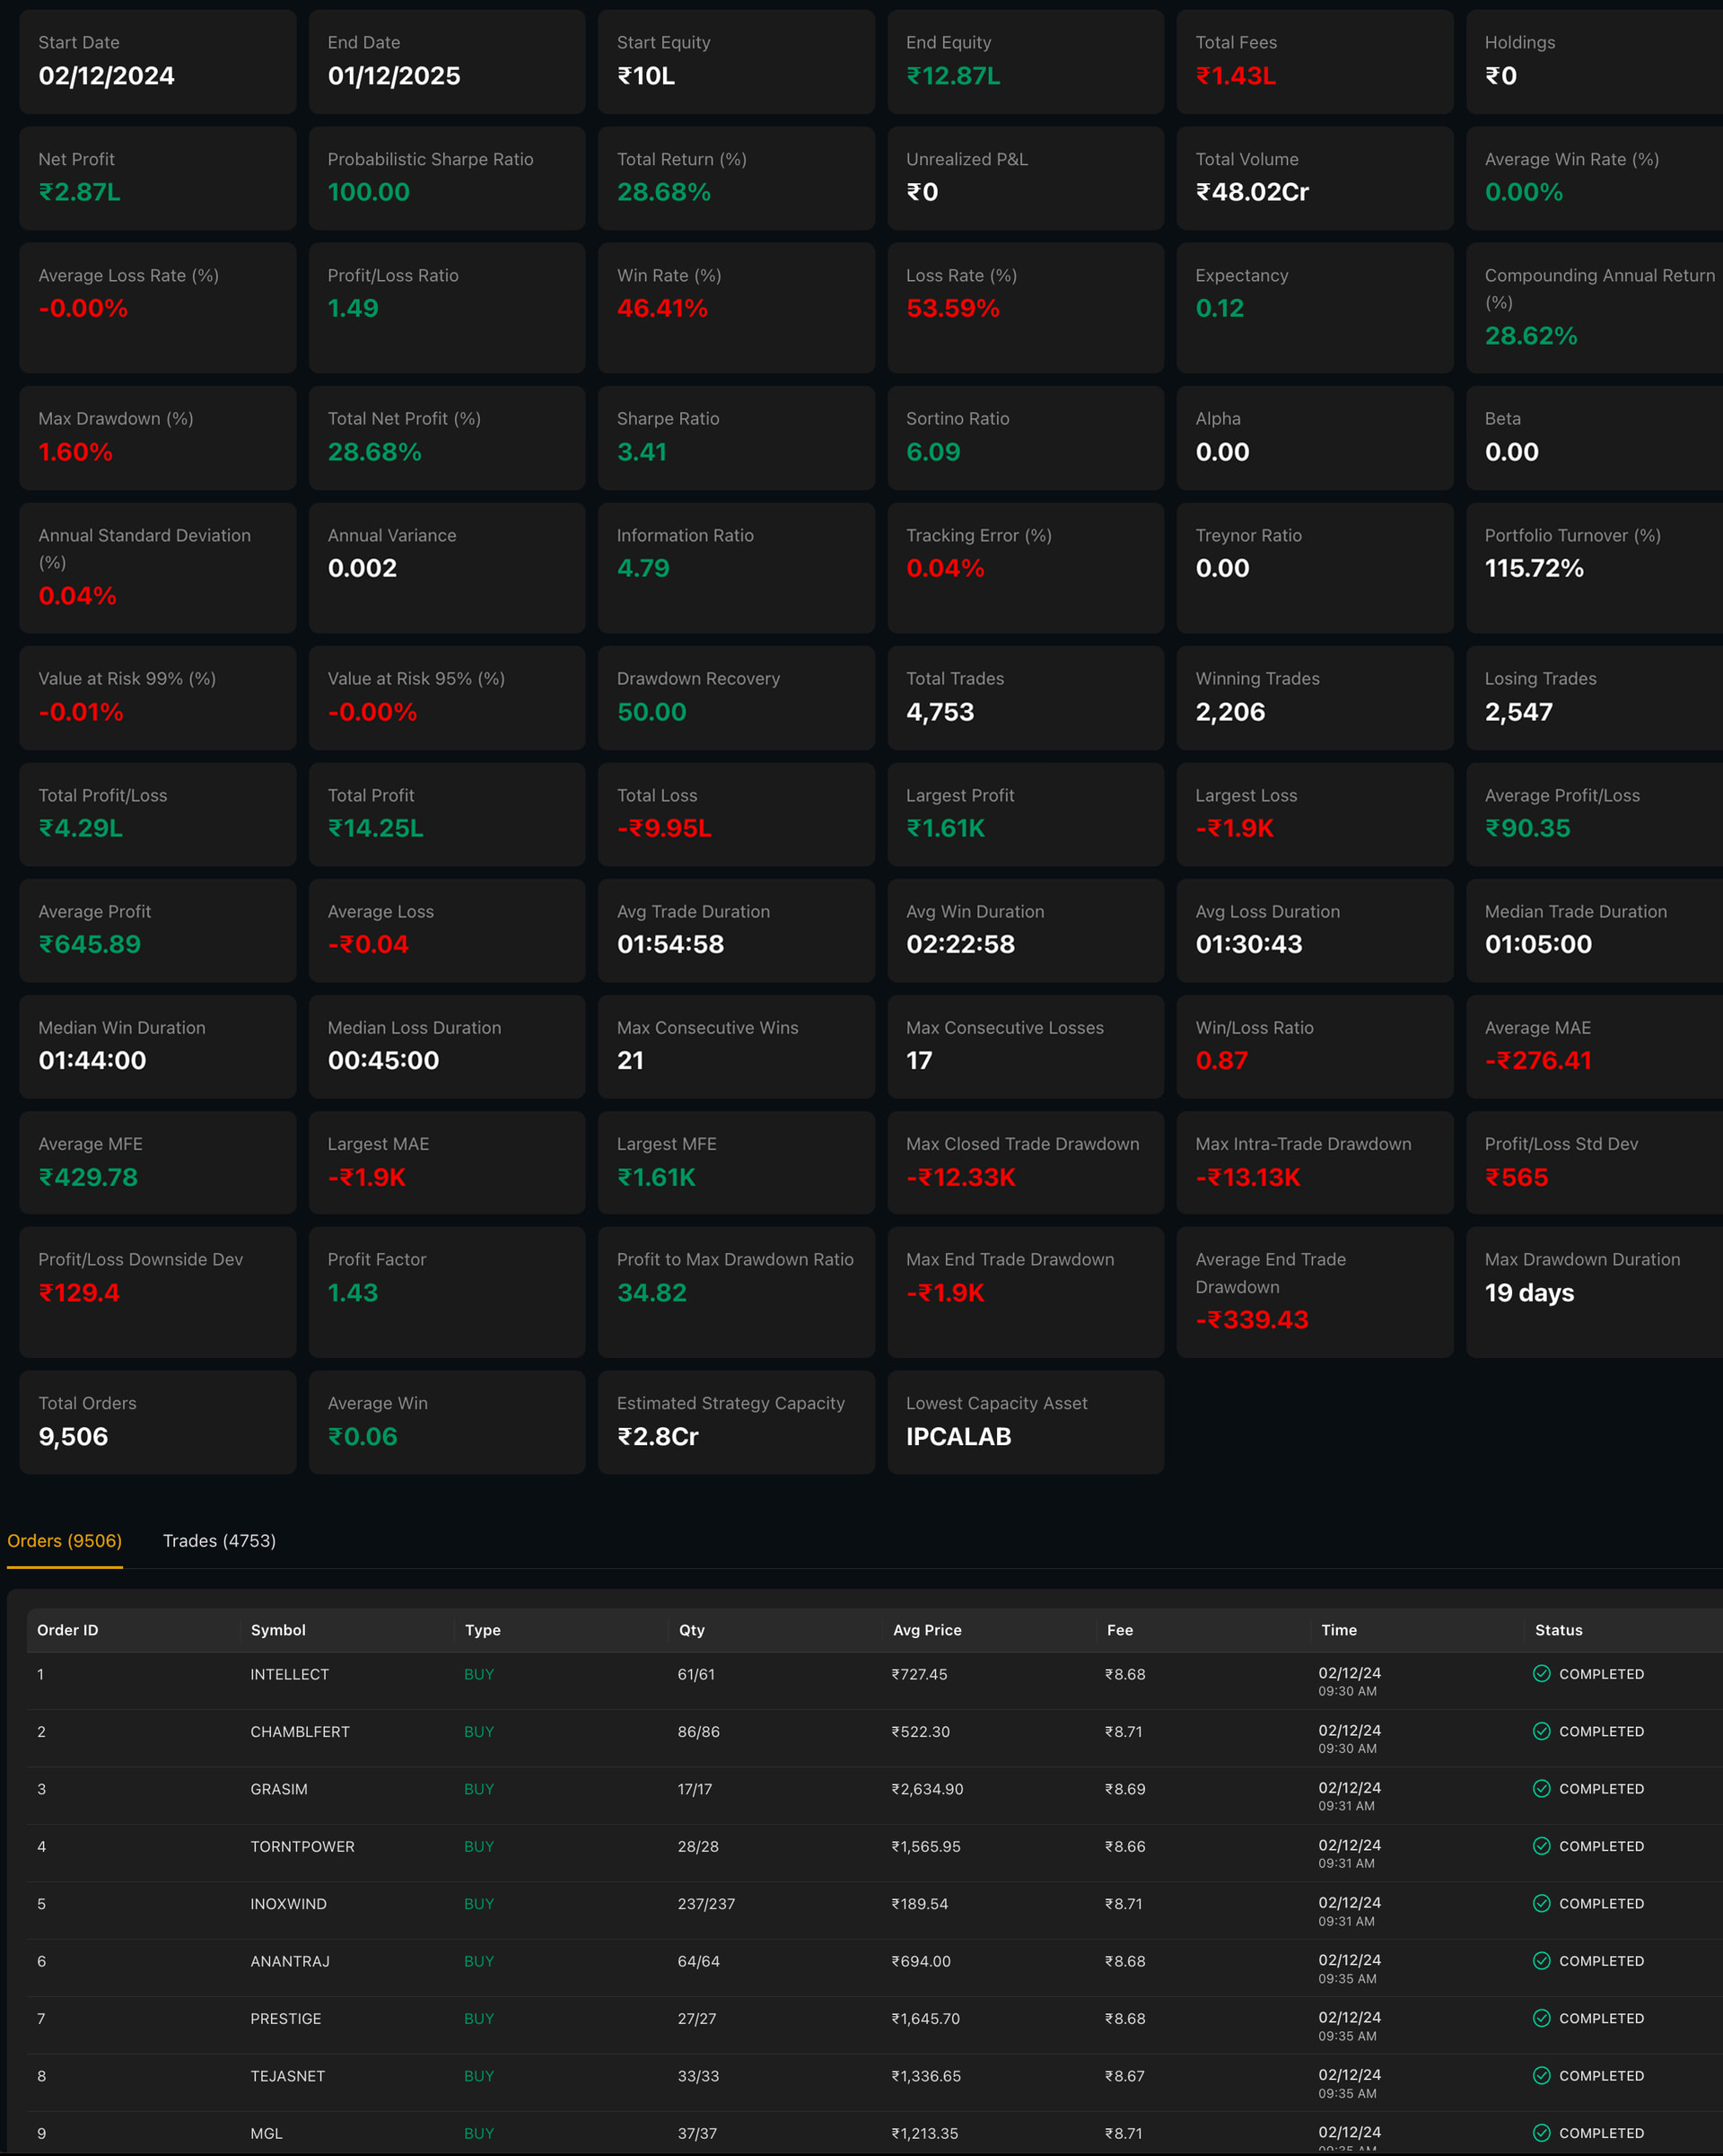
4. Outcomes
This Wizzer backtest ran from 02 Dec 2024 to 01 Dec 2025. Over the period, the strategy delivered a +28.68% total return—growing ₹10L → ₹12.87L (net profit ₹2.87L). Over the same window, NIFTY 50 was up about +8.47%, so the strategy outperformed by a wide margin.
The risk profile is the standout. Despite being an intraday system with frequent trading (~4,753 trades), the strategy kept drawdowns very contained with max drawdown ~1.60%, while still posting strong risk‑adjusted performance (Sharpe ~3.41, Sortino ~6.09, Information Ratio ~4.79). In other words: the backtest shows a combination of meaningful absolute returns + strong benchmark outperformance + unusually low drawdown for the period.
5. References
5.1 Our materials
- Comprehensive Strategy Video (YouTube / Loom)

-
Strategy Document
 Click to open
 -
Research Paper Pack (Folder)
Click to open
6. Contact us
If you’d like the full research pack, detailed backtest outputs, or a walkthrough of how we implement intraday breakout systems on Wizzer, reach us on WhatsApp:
+91-8928065586