1. Research and Background
1.1 The intuition behind rotating capital
Equity markets are never perfectly balanced. At any point in time, some parts of the market are leading – delivering stronger risk‑adjusted returns – while others are lagging. This shows up at two main levels:
-
Sectors: groups of companies exposed to similar economic drivers (banks, IT, autos, pharma, etc.).
-
Factors or styles: characteristics of stocks such as value, momentum, quality, low volatility, size and so on.
The core idea of sector and factor rotation is simple:
Instead of holding a fixed mix of sectors and styles forever, deliberately rotate capital into the sectors and factors that are currently being rewarded by the market, while reducing exposure to those that are out of favour.
The empirical question is whether this rotation actually generates alpha (risk‑adjusted excess return) after controlling for market exposure, risk and costs. A large body of academic and practitioner work suggests that, when done in a disciplined way, the answer can be yes.
1.2 Sector rotation: business cycles, dispersion and momentum
Historically, sector rotation was framed as a business‑cycle timing problem: cyclicals and financials were thought to outperform in expansions, while defensives like FMCG, utilities and healthcare were expected to lead in slowdowns or recessions. Classic textbooks such as Bodie, Kane and Marcus (Investments, 2009) and Lofthouse (Investment Management, 2001) explain sector rotation in exactly these terms.
More recent research has stress‑tested whether this intuition converts into systematic alpha:
-
Macroeconomic sector rotation – mixed evidence
Molchanov and Stangl’s paper The Myth of Sector Rotation (2018) and later work such as The Myth of Business Cycle Sector Rotation (International Journal of Finance & Economics, 2022) examine popular business‑cycle‑based sector rules and find little evidence that simple macro‑timing of sectors reliably outperforms once transaction costs and timing errors are considered. At best, the gains are modest and fragile. -
Sector/industry momentum and dispersion – stronger support
In contrast, there is stronger evidence for momentum‑ and dispersion‑driven sector rotation. Moskowitz and Grinblatt (1999), in their Journal of Finance paper Do Industries Explain Momentum?, show that a large portion of the well‑known stock‑level momentum effect is actually driven by industry‑level momentum: industries and sectors that have recently outperformed tend to keep outperforming over intermediate horizons. This implies that simply tilting towards “winner” sectors and away from “loser” sectors can be a powerful source of return.More recent work such as Gauging the Effectiveness of Sector Rotation Strategies(Apostolidis et al., 2020) tests sector rotation rules in US and European markets between 1999–2019. They compare strategies that switch sectors using interest‑rate signals, momentum signals and Fama–French factor alphas, and find that momentum and factor‑based sector switches can generate excess returns, especially in the presence of strong cross‑sector dispersion.
-
Relative strength vs a sector benchmark
Practitioners have increasingly moved from looking at absolute prices to relative performance versus a diversified sector benchmark. Instead of asking, “Is IT making new highs?”, the question becomes, “Is IT outperforming a composite of all sectors over the last 3–12 months?” Persistent relative‑strength trends at the sector level are now a core ingredient in many sector rotation frameworks used by asset managers.
The broad takeaway from this literature is that rotating capital towards sectors with strong and improving relative performance, and away from sectors with weak and deteriorating relative performance, has empirical support as a source of alpha, whereas naïve macro‑cycle prediction has a weaker track record.
1.3 Visualising sector leadership with Relative Rotation Graphs (RRG)
One of the most widely used tools to represent sector rotation in practice is the Relative Rotation Graph (RRG), developed by Julius de Kempenaer in the mid‑2000s. RRGs were first launched on Bloomberg terminals in 2011 and are now available on platforms like StockCharts, Optuma and others.
An RRG plots each sector on two dimensions:
-
Relative Strength (RS‑Ratio): how the sector has performed versus a chosen benchmark (often an equal‑weighted or cap‑weighted composite of all sectors).
-
Relative Strength Momentum (RS‑Momentum): whether that relative performance is improving or deteriorating.
This creates four quadrants:
-
Leading – strong relative strength and positive momentum.
-
Weakening – strong, but momentum is fading.
-
Lagging – weak and deteriorating.
-
Improving – weak, but momentum is turning up.
Empirically, sectors tend to move clockwise through these quadrants over time: from improving to leading, then weakening, then lagging, and eventually back to improving. This pattern has been documented extensively in Kempenaer’s own research notes and practitioner articles, as well as in technical‑analysis literature and CMT Association materials.
From an alpha‑generation perspective, RRG‑style analysis formalises a simple philosophy:
-
Focus capital on Leading sectors, where both relative performance and its momentum are positive.
-
Be cautious or underweight where momentum is clearly negative (Lagging or Weakening).
-
Watch the Improving quadrant for early signs of new leadership and potential future overweights.
The potential for outperformance comes from building a systematic, rules‑based process around this idea: enter leadership trends early enough and cut exposure to laggards before the bulk of the drawdown, rather than relying on ad‑hoc sector bets.
1.4 Factor investing: persistent premia and time‑varying rewards
Separately from sectors, decades of research have documented that certain stock characteristics, or factors, are associated with persistent differences in average returns. Some of the most studied factors are:
-
Value – cheap vs expensive stocks on measures like P/E, P/B, EV/EBITDA or cash‑flow yields.
-
Momentum – recent winners vs losers (typically measured over 6–12 month formation periods).
-
Quality – profitable, low‑leverage, stable businesses.
-
Low Volatility / Low Beta – stocks with lower historical volatility or market beta.
-
Size – smaller vs larger market capitalisation.
Fama and French (1992, 1993) provided the early empirical foundations by documenting size and value premia in US equities. Carhart (1997) extended this to a four‑factor model by adding momentum. Since then, a wide range of studies have confirmed that these factors appear in many countries and asset classes.
MSCI’s research paper Foundations of Factor Investing(Bender, Briand, Melas, Subramanian, 2013) and Robeco’s Guide to Factor Investing summarise this evidence for institutional investors: value, size, low volatility, quality, yield and momentum are treated as long‑term equity risk premia that have historically delivered excess returns over the broad market. Asness, Moskowitz and Pedersen (2013) in Value and Momentum Everywhere (Journal of Finance) show that value and momentum premia are remarkably consistent across eight major markets and asset classes, suggesting they are not just a US equity anomaly.
At the same time, these papers and many others emphasise three important points that are directly relevant for rotation:
-
Factors work over long horizons, but not all the time.
Every factor has extended periods of underperformance. Value, for example, suffered a prolonged “winter” in the decade after the Global Financial Crisis, while momentum tends to get hurt around sharp regime shifts. Quality and low‑volatility typically lag in speculative rallies. -
Factors are imperfectly correlated.
Bender et al. (2013) and subsequent MSCI work show that combining several factors in a multi‑factor portfolio improves risk‑adjusted returns by diversifying across style cycles. When one style is in a drawdown, another often provides a partial offset. -
Factor premia are time‑varying and linked to macro/market conditions.
Studies such as Ilmanen et al. (2014) and Harvey et al. (2015) document that the strength of factor premia varies with economic regimes, market volatility and investor risk appetite. This observation opens the door to tactical tilts across factors, rather than static allocations.
1.5 Factor rotation: timing the styles themselves
If factors have their own performance cycles, a natural extension is factor rotation: instead of holding fixed weights in each factor, periodically tilt the portfolio towards factors that are currently delivering positive risk‑adjusted returns, and away from those that are persistently lagging.
Kwon (2022), in Dynamic Factor Rotation Strategy: A Business Cycle Approach (International Journal of Financial Studies), explicitly builds dynamic factor rotation strategies that adjust exposures to value, size, momentum, quality and low‑volatility based on a real‑time macro regime indicator. The study finds that shifting exposures towards the factors that historically work best in each regime can improve risk‑adjusted performance relative to a static multi‑factor allocation.
Other work, such as the MDPI paper What Financial Conditions Affect Dynamic Equity Risk Factor Performance?(2022), similarly concludes that time‑variation in factor premia legitimises tactical factor allocation and factor timing, especially when informed by macro or market‑based signals. On the practitioner side, whitepapers from managers like Invesco and FTSE Russell describe dynamic multi‑factor indices that tilt towards factors expected to outperform in the current macro regime, again with the goal of enhancing returns and reducing drawdowns versus static smart‑beta.
Mechanically, most factor rotation implementations follow a common pattern:
-
Define a set of factor proxies (e.g., long‑only factor indices or long–short factor portfolios).
-
Use medium‑term lookbacks (e.g., 3, 6 or 12 months) and/or regime indicators to measure which factors are currently being rewarded.
-
Increase portfolio weight to those factors and reduce weight to factors with poor recent performance or adverse regime sensitivities.
-
Maintain diversification so that the portfolio is not overly dependent on a single style.
The aim is not to perfectly call turning points, but to systematically lean into factor strength – much as a sector rotation strategy leans into sector strength.
1.6 Putting sector and factor rotation together (conceptually)
Conceptually, sector and factor rotation are two layers of the same idea:
-
Sector rotation operates on the coarse grouping of companies by industry and economic exposure. It seeks alpha from cross‑sector leadership and laggardship, often driven by macro trends, earnings cycles and investor flows.
-
Factor rotation operates on stock characteristics within and across sectors, seeking alpha from time‑varying rewards to styles such as value, momentum and quality.
Combining them can, in principle, unlock several benefits:
-
Multiple sources of alpha
Outperformance can come from being in the right sectors and from holding the right factor exposures within those sectors. -
Better diversification of risk
Sector and factor effects are related but not identical. A portfolio that diversifies across both dimensions can be less dependent on any single macro theme or style cycle. -
Cleaner expression of views
Rotating into a leading sector and, within it, into stocks aligned with currently rewarded factors is a more precise expression than simply buying the broad market or a single‑factor screen. -
More efficient use of information
Sector‑level information (macro sensitivity, regulation, industry structure) complements stock‑level factor signals (valuation, profitability, momentum, volatility), giving a richer lens on where the market is directing capital.
In short, the research literature suggests that systematically rotating capital into leading sectors and rewarding factors, and away from lagging sectors and punished factors, can be a robust source of alpha, provided it is implemented in a disciplined, diversified and cost‑aware way.
2. Strategy construction
Here we move from research to implementation. At a high level, we turn the ideas of sector and factor rotation into a rules‑based portfolio running on the Indian equity universe, without going into every micro‑spec.
2.1 Investable universe
We start by defining where we are allowed to invest. The strategy is anchored on the major NSE sectoral indices – NIFTY Auto, Bank, Financial Services, FMCG, IT, Pharma, Metals, Realty, Oil & Gas, PSU Banks, Private Banks and others. Each index represents one economic segment. From there we map down to individual stocks: for each sector, we build a list of NSE‑listed, liquid companies that genuinely belong to it, using index constituents and official classifications. This gives us a sector‑mapped universe that covers most large and mid‑caps while avoiding illiquid names that are hard to trade.
2.2 Sector Rotation Engine (SRE)
On top of this universe sits our Sector Rotation Engine – the top‑down layer that decides which sectors get capital. Conceptually, the SRE takes the Relative Rotation Graph (RRG) idea and turns it into a simple scoring system. For each sector, we look at its performance versus a broad sector benchmark (an equal‑weighted basket of all sectors) over a medium‑term window. From this relative return history we derive two scores analogous to RS‑Ratio and RS‑Momentum and use them to place each sector in one of four quadrants: Leading, Weakening, Lagging or Improving.
The allocation rule is intentionally straightforward: we only deploy capital into sectors in the Leading quadrant, and we require that leadership to persist for a short confirmation period before a sector becomes investable. We also cap the number of sectors we hold at any time, so the portfolio stays focused on a small set of leadership themes instead of owning everything. When a sector loses leadership and remains weak, capital is gradually withdrawn and rotated into sectors that have newly moved into the Leading area. This creates a systematic, rules‑based rotation of capital as sector leadership changes.
2.3 Factor Rotation Layer (FRL)
Once sectors are chosen, the next question is which stocks to own inside them. Here we use a Factor Rotation Layer. Within each sector, every stock is evaluated on six dimensions – momentum, value, quality, low volatility, size and institutional participation. Raw information (price history, valuations, profitability, volatility, free‑float market cap, FII/DII data) is converted into standardised sector‑relative scores so that different stocks within the same sector can be compared on a common scale.
In parallel, we track how each factor itself is performing at the market level using proxy indices or synthetic portfolios. Over a rolling window we identify which styles have been rewarded recently; these are treated as the “active” factors for the next period. When ranking stocks inside a leading sector, every name gets a base multi‑factor score, but the currently active factors receive a modest extra weight. The result is a ranked list of candidates where the top names are both sector‑aligned and style‑aligned. From this, we select a small, liquid basket of stocks per sector with roughly equal position sizes, subject to basic liquidity and concentration limits.
2.4 Rebalancing and implementation
Finally, we define how often signals can change and how trades are executed. The design sits deliberately in the medium‑term, low‑frequency space. Sector scores are monitored daily but we only change sector allocations when confirmation rules are met, so we are reacting to genuine shifts rather than noise. Factor tilts are updated more slowly (for example, monthly), reflecting that style cycles move at a different pace than individual stock prices. Stock selection inside sectors is refreshed on a fixed schedule using the latest prices, factor scores and liquidity checks.
Portfolio changes are implemented in scheduled rebalancing windows. Trades respect liquidity thresholds and sector/stock caps, and we explicitly account for transaction costs when deciding how aggressively to rotate. The result is a portfolio that adjusts to evolving sector and factor leadership with a controlled turnover profile: active enough to capture meaningful trends, but not so busy that costs overwhelm the benefit.
3. Backtests
This section summarises how we tested the strategy, not every line of code. The full details (lookback windows, universe filters, transaction-cost model, etc.) are in our internal research docs and the formal strategy document.
All of this is implemented directly on the Wizzer platform. The backtest runs on point‑in‑time universes and data – sector and index constituents as they actually existed at each date, fundamentals and shareholding data without look‑ahead bias, corporate events (splits, bonuses, dividends) applied correctly, and real‑time price series. Every trade is evaluated after explicit transaction costs and fees, so the numbers you see are net of realistic trading frictions.
3.1 Data and universe
-
Market: Indian equity market, using NSE sectoral indices and their mapped constituents.
-
History: Multi-year daily OHLCV data, long enough to cover multiple market regimes (bulls, bears, sideways, high-vol, low-vol).
-
Fundamentals & holdings: Quarterly fundamentals and shareholding data for value, quality, size and institutional participation factors.
4. Outcomes
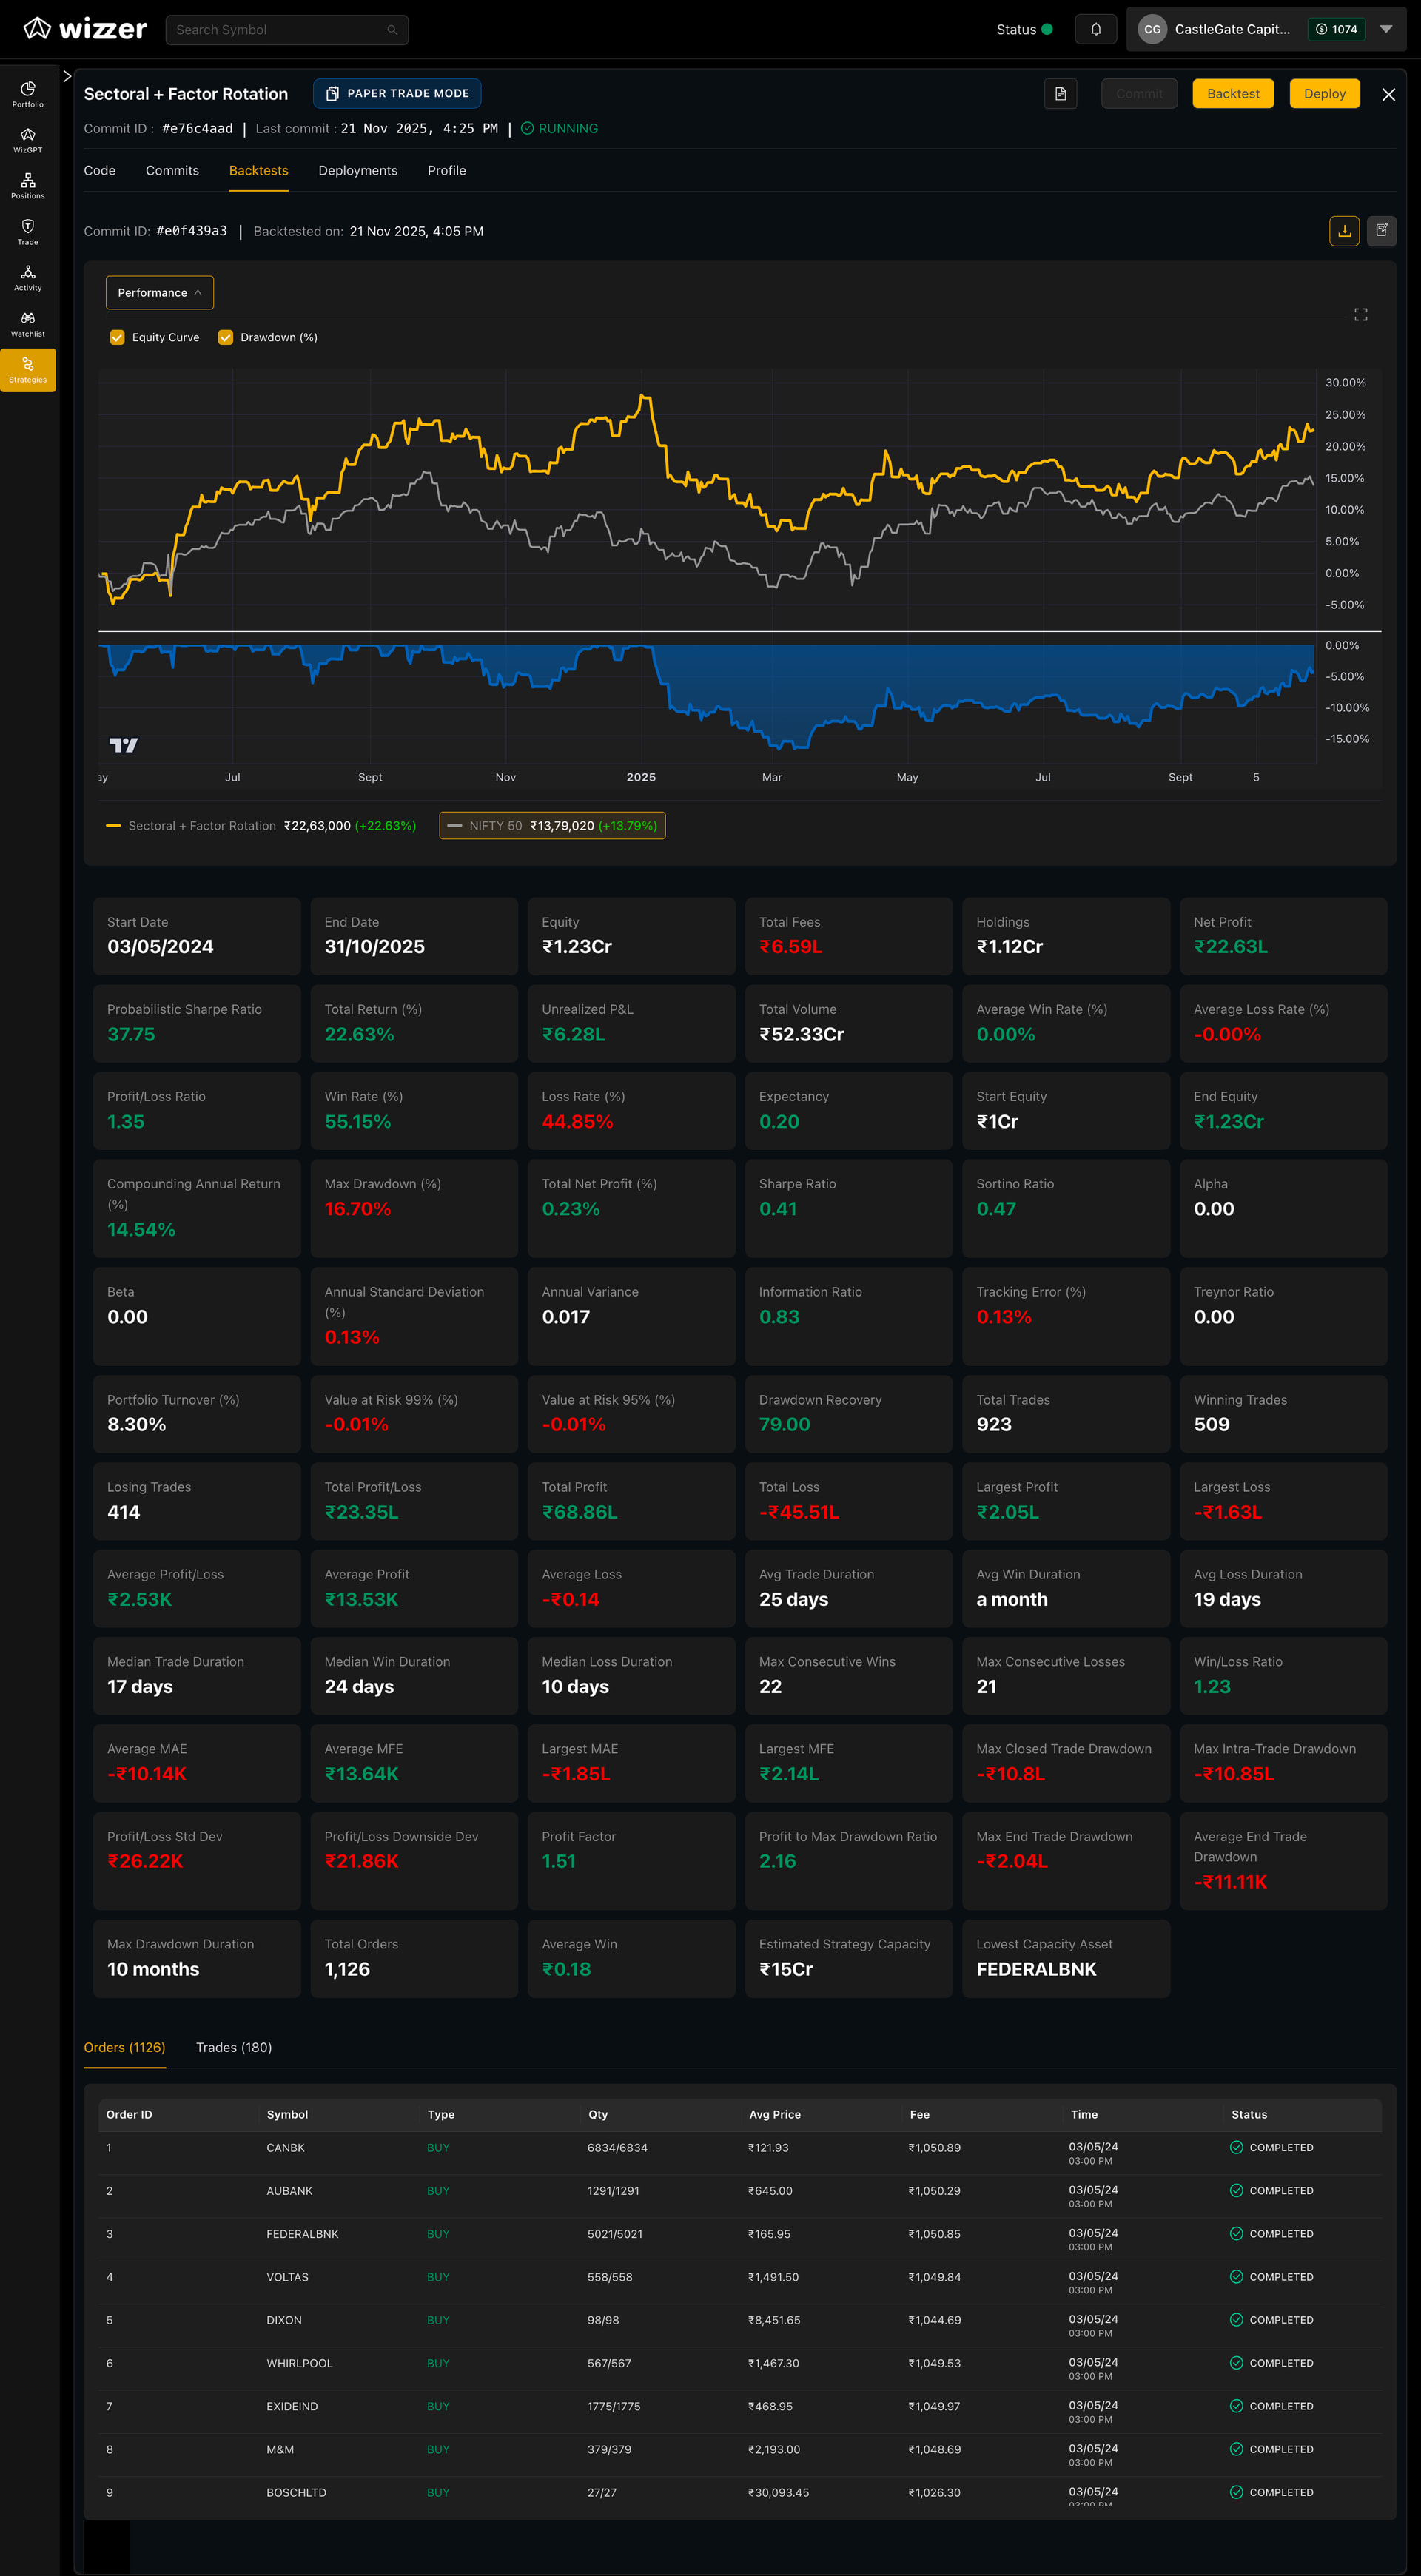
We tested the strategy on a ₹1 crore paper‑trade portfolio on Wizzer from 3 May 2024 to 31 October 2025, using live market data and the full sector + factor rotation stack.
Over this period, the portfolio grew to about ₹1.23 crore – a total return of ~22.6%, compared with roughly 13.8% for a simple NIFTY 50 buy‑and‑hold. That is, the strategy generated around 9 percentage points of excess return over the index while staying broadly in line with market risk.
In risk terms, the backtest shows a compounding annual return of ~14.5% with a maximum drawdown of ~16.7%, implying a profit‑to‑max‑drawdown ratio of just over 2x. At the trade level, the system ran with a win/loss ratio a little above 1.2 and a profit factor of roughly 1.5, indicating that winners were both more frequent and larger than losers on average.
Together, these numbers suggest that a disciplined sector + factor rotation process can deliver meaningful alpha over a broad index while keeping drawdowns within a range that looks implementable in practice.
5. References
Our materials
- Comprehensive Strategy Video
In-depth walkthrough of the full Sectoral + Factor Rotation framework, live examples, and Q&A.

-
Strategy Document (PDF)
Formal write-up with methodology, data definitions, and implementation details, including full SRE and FRL design.
 View here
 -
Research Paper Pack (Folder)
A curated folder of PDFs covering sector rotation, factor premia, multi-factor index design and RRG methodology.
View here
6. Contact us
If you’d like to:
-
Understand the strategy in more detail,
-
Discuss how it fits into your existing portfolio, or
-
Explore custom implementations / integrations,
you can reach us directly on WhatsApp at:
+91-8928065586
We’re happy to share the detailed deck, sample performance reports, and answer any questions on methodology, risk or implementation.