1. Research and Background
1.1 Why the opening range matters
The first few minutes after the market opens often contain a disproportionate amount of information and volatility. Overnight news, global cues, gaps, and pent‑up order flow all get translated into prices in a very short burst of trading.
One way traders have tried to organise this chaos is by defining an Opening Range (OR) – typically the high and low of the first few minutes of trading – and then watching how prices behave around those levels. The basic intuition is simple:
If the market decisively breaks out of a well‑defined opening range on strong activity, it may be revealing the true intraday direction of order flow.
The opening range acts like a short‑term “auction” where buyers and sellers discover a fair price. When price subsequently escapes that range and keeps going, it suggests that one side (buyers or sellers) is dominating, and that directional move can sometimes persist for the rest of the session.
This idea is closely related to the broader concepts of price momentum and trend‑following that have been studied extensively in academic finance. In practitioner literature, authors like Toby Crabel (Day Trading with Short‑Term Price Patterns and Opening Range Breakout) and Mark Fisher (The Logical Trader: Applying ACD to Trading and Risk Management) have explored in detail how structured rules around the open, narrow ranges and breakout levels can be used to capture short‑term directional moves.
Microstructure studies on intraday volume and volatility patterns also show that volatility and volume are typically highest near the open and close of the trading day, and that the opening auction and first few minutes of trading are when overnight information is impounded into prices. Taken together, this supports the idea that early‑session price action contains valuable information, and that well‑defined opening‑range levels can serve as objective anchors for breakout strategies.
1.2 Momentum and trend‑following: the bigger picture
A large body of research shows that assets that have performed well recently tend, on average, to continue outperforming over the short to medium term, and vice‑versa for recent losers. This is the essence of momentum.
In equities, the classic evidence comes from Jegadeesh and Titman (1993), “Returns to Buying Winners and Selling Losers” (Journal of Finance), which shows that stocks with strong 3–12 month past returns continue to outperform laggards over the next few months. International evidence from Rouwenhorst (1998), “International Evidence on Momentum Strategies” (Journal of Finance) extends this result to European markets, showing that momentum is not just a US phenomenon but appears across countries as well.
Beyond individual stocks, momentum and trend‑following have been studied across asset classes. For example, Asness, Moskowitz and Pedersen (2013), “Value and Momentum Everywhere” (Journal of Finance) document that value and momentum premia show up in equities, bonds, currencies and commodities. On the pure trend‑following side, Hurst, Ooi and Pedersen (2017), “A Century of Trend‑Following Investing” (Journal of Portfolio Management) show that simple time‑series trend rules applied to futures and forwards across many markets have delivered positive long‑run returns with low correlation to traditional portfolios.
Although these studies mostly use daily or monthly data, the underlying behaviour they capture – under‑reaction, slow information diffusion, herding and trends – can also show up within the trading day, especially around key reference levels like the open.
From this perspective, an Opening Range Breakout (ORB) strategy is simply an intraday expression of momentum:
-
The opening range summarises where the early tug‑of‑war between buyers and sellers took place.
-
A break above the range high is a short‑term momentum signal to the upside; a break below the range low is momentum to the downside.
-
Adding filters for liquidity, volatility and activity (volume) is analogous to the way academic studies control for noise and frictions when measuring momentum.
1.3 Volatility, regimes and when breakouts work
Momentum is not a free lunch. Research such as Daniel and Moskowitz (2016), “Momentum Crashes” (Journal of Financial Economics) shows that momentum strategies can suffer sharp losses during violent market reversals, particularly after deep drawdowns when risk premia shift. Barroso and Santa‑Clara (2015), “Momentum Has Its Moments” (Journal of Financial Economics) demonstrate that scaling momentum exposure up and down with volatility can significantly improve its risk‑adjusted performance and mitigate these “crash” episodes. More broadly, Moreira and Muir (2017), “Volatility‑Managed Portfolios” (Journal of Finance) show that systematically reducing risk when volatility is high and increasing it when volatility is low can improve Sharpe ratios across a range of strategies.
These ideas carry over naturally to intraday breakout trading:
-
ORB‑style strategies tend to work best in highly active, directional markets – for example, on days with strong news, gaps and follow‑through, when volatility is elevated but not chaotic.
-
They tend to struggle in choppy, range‑bound intraday markets, when prices oscillate around the opening range and breakouts frequently fail.
This is why serious breakout traders emphasise regime awareness and volatility filters. Rather than blindly trading every breakout, they:
-
Focus on instruments and days with sufficient volatility and liquidity to support a meaningful move.
-
Use Average True Range (ATR) or related measures to ensure the opening range is not too wide (leaving little room for follow‑through) or too narrow (overly sensitive to noise).
-
Monitor intraday volume relative to historical norms as a proxy for participation: real breakouts tend to be accompanied by strong volume.
In other words, an opening range breakout is most promising when the market is informative, energetic and directional, and least promising when it is indecisive and low‑energy.
1.5 Putting it together: why an ORB framework can work
Bringing this research and practitioner evidence together, an Opening Range Breakout framework rests on a few key principles:
-
Information concentration: Overnight news and order flow concentrate around the open. The opening range captures this initial price discovery.
-
Short‑term momentum: When price breaks decisively out of the opening range, it often reflects continuation of that initial pressure rather than a random blip.
-
Regime dependence: ORB performs best in volatile, news‑driven, directional markets and worst in low‑volatility, mean‑reverting ones. Filters for volatility, liquidity and volume are therefore critical.
-
Risk management: Because false breakouts are inevitable, tight but adaptive risk controls – for example, ATR‑based stops and fixed intraday cut‑off times – are essential to make the payoff profile attractive.
The strategy we describe next is one implementation of these ideas on a diversified universe of liquid NSE stocks, using the Wizzer platform.
2. Strategy construction
In this section we outline how we have turned the opening range breakout idea into a rules‑based, multi‑stock intraday strategy on the Indian equity market.
2.1 Universe and pre‑trade filtering
We begin by defining a universe of liquid NSE stocks that are suitable for intraday trading. Instead of looking at the entire market, we apply simple filters on price, average traded volume, realised volatility and market capitalisation to exclude illiquid names, extremely low‑priced stocks and instruments that simply do not move enough to justify an intraday breakout approach. This universe is updated using end‑of‑day data, so that each new session starts with a point‑in‑time watchlist of stocks that are both liquid and active.
2.2 Opening range and activity
At the start of the trading day, the strategy observes how each stock in the watchlist trades during the initial minutes after the open and uses this to define that stock’s opening range – the price band in which the early auction between buyers and sellers takes place. We also look at how much volume trades during this initial window, relative to what is normal for that stock at the open. Only when the opening range is formed with meaningful participation does the stock remain eligible. This avoids building a breakout thesis on thin, easily distorted moves.
2.3 Systematic breakout entries
Once the opening range is defined and validated, the strategy spends the rest of the session simply watching how price behaves around those levels. If price breaks and holds above the opening range, the system interprets that as upward pressure winning the early tug‑of‑war and initiates a long position. If price breaks and holds below the range, it takes a short. Entries and position sizes are generated mechanically by the strategy’s rules rather than by discretionary judgement, and each stock is allowed only a limited number of opportunities per day so that we are not constantly flipping direction on every minor wiggle.
2.4 Risk management and intraday exit
Risk management is built directly into the ORB framework. Once in a trade, the system uses a volatility‑aware trailing mechanism to decide when to exit, allowing profitable moves room to extend while cutting losing trades relatively quickly if the breakout fails. In some cases, if a clear failure of the initial breakout is followed by a decisive move through the opposite side of the opening range, the rules permit a single reversal trade, but only under specific conditions.
All positions are strictly intraday: by design, the strategy does not carry risk overnight. Any open trades are closed near the end of the session according to a fixed time‑based exit rule, regardless of profit or loss. Taken together, these elements – pre‑trade filtering, objective opening ranges, mechanical breakout entries and disciplined, volatility‑aware exits – turn the ORB concept into a repeatable, systematic process that can be applied consistently across a diversified basket of stocks.
3. Backtests
This section focuses on how we tested the Opening Range Breakout framework, rather than every line of implementation.
All backtests are run on the Wizzer platform using 5‑minute OHLCV data for NSE stocks. The workflow mirrors the live logic:
-
We construct the daily watchlist using point‑in‑time fundamentals and trading data, applying the same price, volume, ATR and market‑cap filters that the live strategy uses.
-
For each trading day, we form the opening range from the first 5‑minute bar, apply the relative volume filter, and then simulate breakout entries, trailing stops, flip trades and the 3:00 PM exit exactly as in the live rules.
-
Corporate actions such as splits and bonuses are handled so that price series and ATR values remain consistent over time.
To make results realistic, we incorporate transaction costs and slippage assumptions appropriate for liquid Indian equities (brokerage, fees and a conservative bid–ask spread estimate). These are applied to every entry and exit, so reported performance is net of trading frictions.
4. Outcomes
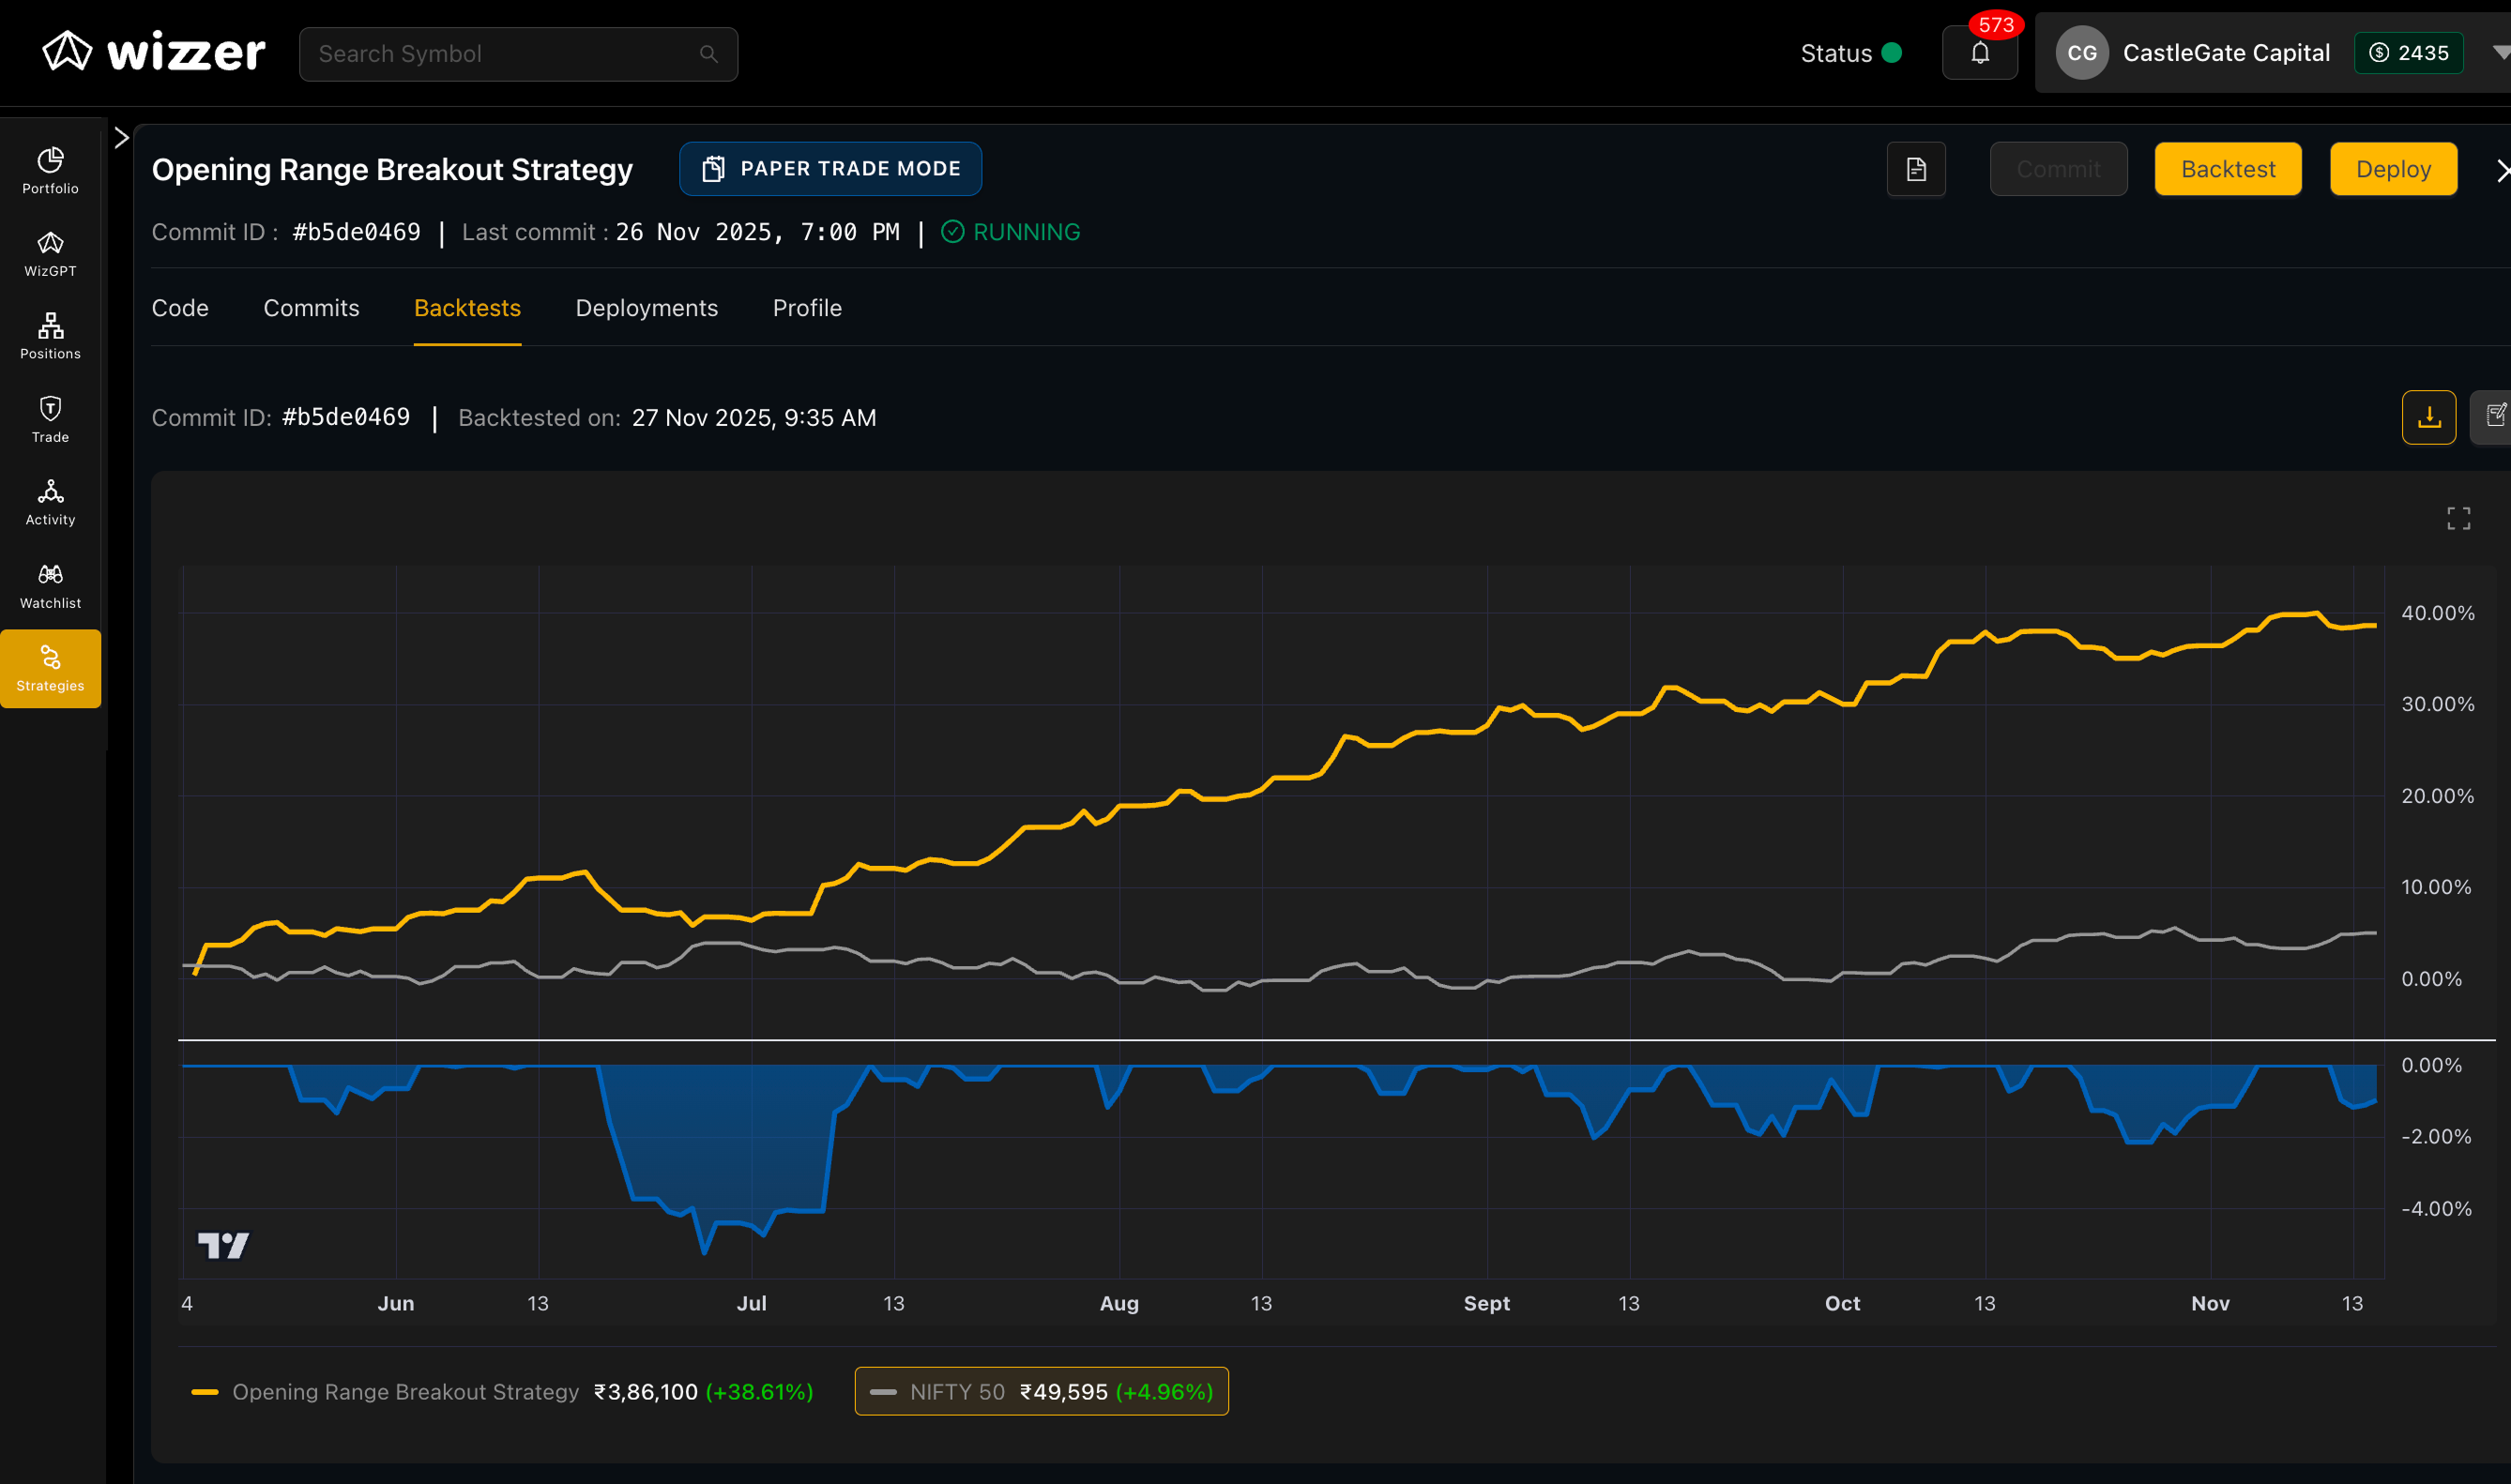
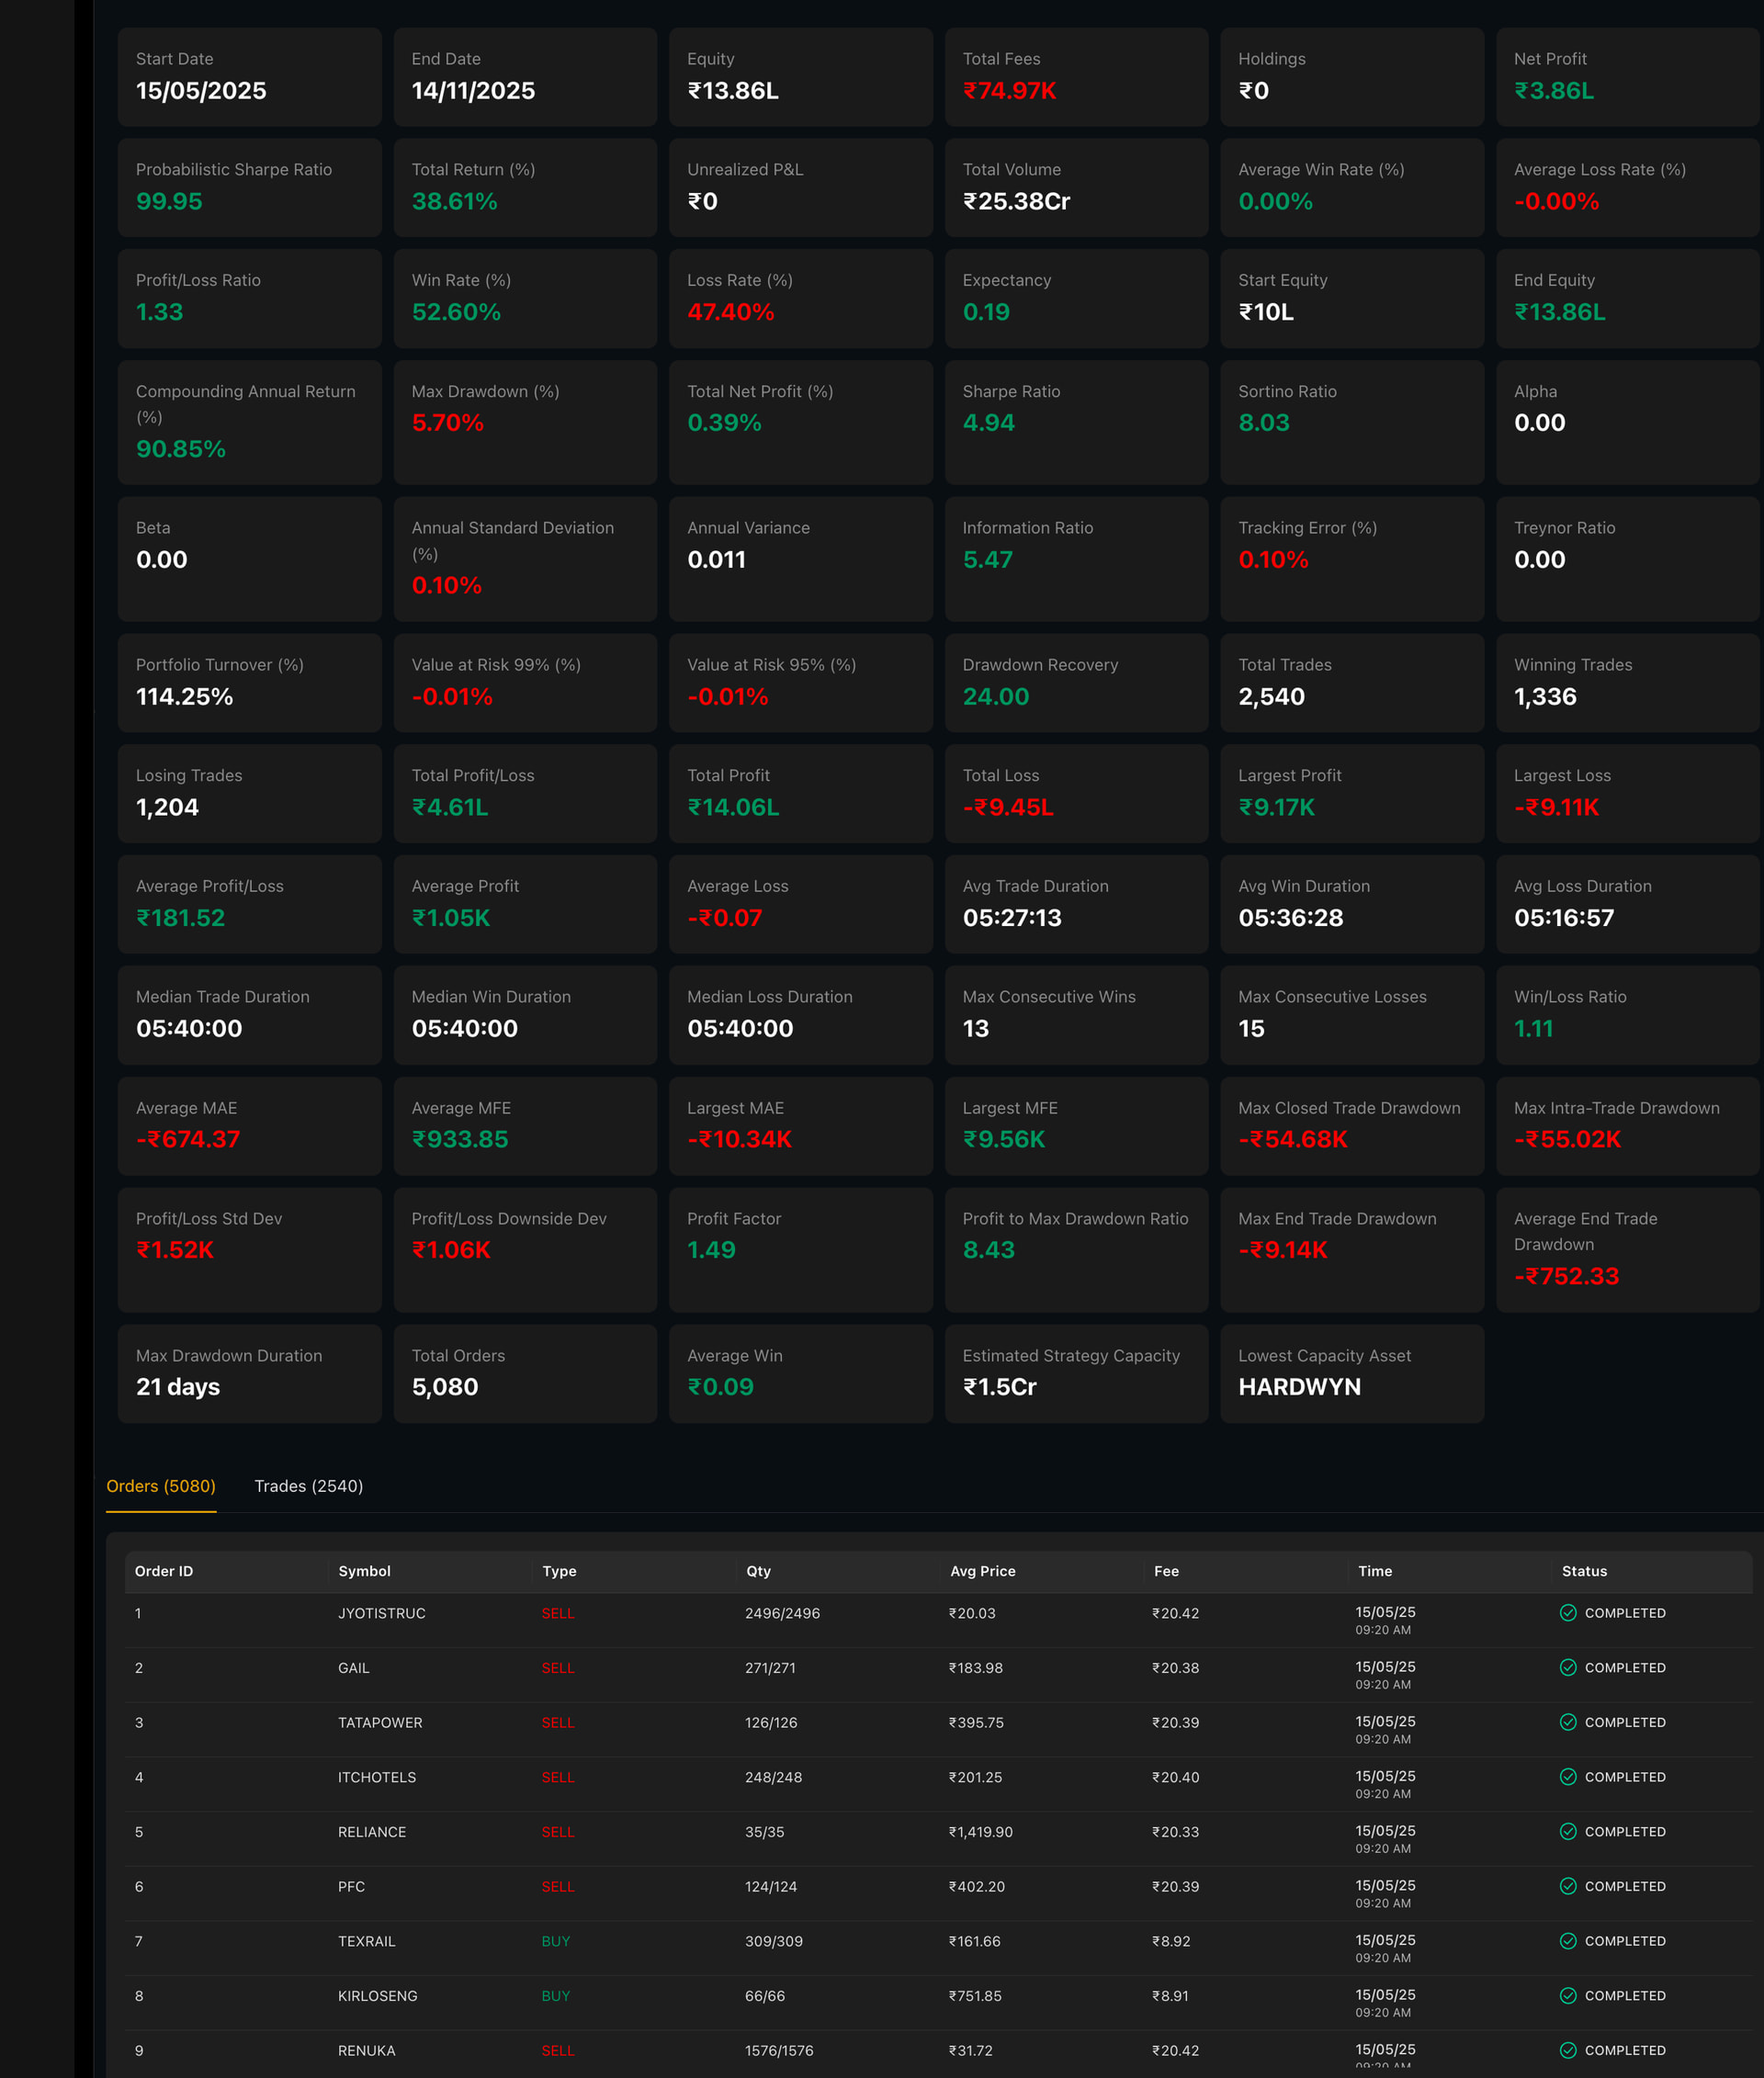
We backtested the Opening Range Breakout strategy on the Wizzer platform from 15 May 2025 to 14 November 2025, starting with a notional capital of ₹10 lakh. Over this six‑month window the strategy grew the capital to around ₹13.86 lakh, a net return of ~38.6%, compared with roughly +25% for a simple NIFTY 50 buy‑and‑hold over the same period. In annualised terms this corresponds to a compounding return of just over 90%, despite operating strictly intraday and after accounting for realistic transaction costs.
What stands out in this backtest is not just the return, but the quality of the risk profile. The strategy achieved this performance with a maximum drawdown of only ~5.7%, a Sharpe ratio of ~4.9 and a Sortino ratio above 8.0. The profit factor is around 1.5 and the profit‑to‑max‑drawdown ratio is above 8x, indicating that cumulative gains over the period were many times larger than the worst peak‑to‑trough decline.
At the trade level, the system executed roughly 2,500 trades with a win rate of about 53% and a profit/loss ratio above 1.3, meaning that average winners were meaningfully larger than average losers. Combined with tight, volatility‑aware risk controls and a hard intraday exit, this produces the characteristic profile of a healthy breakout engine: moderate hit rate, controlled drawdowns and a P&L curve that climbs steadily on days when post‑open trends are strong.
5. References
5.1 Our materials
Comprehensive Strategy Video (YouTube / Loom)
Walkthrough of the Opening Range Breakout framework on Wizzer, including live chart examples and trade reviews.

-
Strategy Document (PDF)
Formal write‑up of the ORB strategy, including filters, exact rules, risk management parameters and implementation notes.
 View Here
 -
Research Paper Pack (Folder)
Curated PDFs on momentum, time‑series momentum, volatility‑aware momentum, and intraday breakout and opening‑range techniques.
View Here
6. Contact us
If you’d like to:
-
Understand the Opening Range Breakout strategy in more detail,
-
See full backtest statistics and equity curves, or
-
Explore how this intraday approach might fit alongside your existing multi‑day or positional strategies,
you can reach us directly on WhatsApp at:
+91-8928065586
We’re happy to share the detailed deck, additional examples and answer any questions on methodology, risk and implementation details.