Process of creating a Financial Product
One day in July’2025 our team sat discussing ideas on creating a great performing financial product that would still not face the wall of credibility. CastleGate was new and why should anyone trust our product.
A simple strategy we arrived at was - Let’s build a tracking product on an existing super performance mutual fund and build an active management layer on top to generate additional alpha. The beta is coming from the fund’s choices of holdings and weightages - and that should give comfort to investors and the active management layer on top should offer long term and demonstrated alpha that will be constructed as a Quant Product.
This is how our NSCP (Nippon Small Cap PLUS) was born.
Why Nippon Small Cap - because it had a 5 year CAGR of 40%+.
First Why Smart Beta Exists (and What Research Suggests About “PLUS” Alpha)
Most investors begin with a simple goal: own broad market exposure cheaply and transparently. Traditional indexing achieves this through market-cap weighting, but that construction hard-codes certain behaviors—most notably, it can allocate more weight to stocks whose prices have risen (and less to those that have fallen), without explicitly targeting any outcome like value, quality, momentum, or lower volatility.
Smart beta emerged as a middle ground: it keeps the rules-based discipline of indexing, but changes how securities are selected and weighted using systematic characteristics (often called factors) or alternative weighting schemes.
Extend this idea further to Smart Beta + Active Management based on known market anomalies.
____________________________________________________________________________________________
Context: What is CastleGate’s NSCP?
CastleGate’s NSCP (Nippon Small Cap Plus) is a hybrid tracking + active overlay product: it mirrors the Nippon Small Cap Fund as the “core” exposure, and adds a systematic “PLUS” layer on top to try to enhance returns and manage risk built as two sleeves that work together:
-
60% Core Mirror (tracking sleeve): This sleeve mirrors the Nippon Small Cap Fund’s holdings and weights to deliver faithful small-cap exposure.
-
40% Active Overlay (PLUS sleeve): This sleeve takes a select subset from the same holdings universe and applies an additional systematic layer to improve return potential and control risk.
Universe
-
What the strategy can own: The portfolio is built from the Nippon Small Cap Fund’s underlying equity holdings (the same universe powers both the core and the overlay).
-
What that means in practice: The universe is defined by the fund’s mandate and disclosed holdings — NSCP uses the stocks the fund holds, even if that includes names outside a strict “small-cap-only” bucket.
Portfolio type
-
Asset class: Equities.
-
Direction: Long-only.
-
Portfolio modes: The strategy can operate in normal conditions and can also shift into a defensive mode during stress, including a full risk-off state when required.
Rebalance frequency
-
Core sleeve: Updates in line with the fund’s holdings/weights (tracking sleeve).
-
Active overlay: Rebalanced on a weekly cycle, using a rules-based selection process.
-
Risk controls: Evaluated on an ongoing basis with both daily risk checks and intraday monitoring for the active sleeve.
Holding horizon
-
The core sleeve is designed to behave like a tracking sleeve.
-
The active overlay follows a weekly refresh cadence, but positions can be exited earlier if risk conditions trigger.
Constraints
-
Max position weight: A single stock’s weight is capped at 4% of total portfolio.
-
Liquidity: The strategy only trades liquid stocks (illiquid names are avoided).
-
Diversification (sector rule): The active overlay is limited to the top 3 stocks per sector, which helps avoid concentration in a single theme and keeps the overlay diversified.
-
Volatility-aware sizing: Overlay positions are scaled to keep risk within a target range.
-
Drawdown control: A portfolio-level drawdown stop is used to protect capital during adverse periods.
Why this product exists
NSCP exists for a simple reason: pure tracking gives you exposure, but not necessarily better outcomes. We wanted a product that stays anchored to the Nippon Small Cap Fund’s portfolio (so the exposure remains familiar and trackable), while adding a disciplined, rules-based layer that can adapt and improve on top of that base.
Who it’s for
It’s for any investor who want’s to put a large fund into a new advisor and wants simoulatenous safety of Nippon’s returns while going for that additional 4-5% alpha in CAGR due to active management layer.
Design Objectives (North Star)
Objective A — Outperform the fund
NSCP is built to outperform the Nippon Small Cap Fund over time. The core sleeve keeps us anchored to the fund’s exposure, while the active overlay aims to add alpha on top.
Objective B — Rotate capital toward excess return
The active overlay is designed to continuously rotate capital toward areas showing stronger opportunity—so we’re not holding the same set of names by default, but systematically reallocating to where the strategy believes excess return is available.
Objective C — Keep drawdowns minimal through active risk management
Outperformance is not enough if the ride is too rough. A key objective is to control drawdowns using layered risk management, so the strategy can reduce risk in stress conditions and protect capital when markets become unstable.
Objective D — Robustness across market conditions
NSCP is designed to be more than a one-regime strategy. The goal is to hold up across different environments—without relying on a single lucky period or one narrow factor bet.
Objective E — End-to-end feasibility on Wizzer
NSCP is meant to be a real product, not just a research backtest. It must be fully buildable, testable, and deployable on Wizzer, using the platform’s data pipelines and execution workflow—reliably and repeatably.
Original Hypothesis
First-principles belief
We started with a simple belief: the Nippon Small Cap Fund’s holdings provide a strong, investable base, but the path of returns within that portfolio is not smooth. Even though the holdings are majority small-cap (with some large- and mid-cap names as part of the mandate), different parts of the portfolio lead and lag over time.
NSCP is based on the idea that we can stay anchored to the fund through a core mirror sleeve, while using a systematic overlay to improve outcomes by (a) tilting toward areas showing stronger return potential and (b) managing risk actively so drawdowns are not simply endured.
Active management & outperformance thesis
The fund’s holdings give us a broad, investable portfolio. The active overlay exists because we believe that, within the same holdings set, leadership changes over time—some sectors strengthen while others weaken, and within each sector a smaller set of stocks tends to contribute disproportionately to returns.
The overlay is designed to respond to that reality in a structured way:
-
Rotate exposure toward strength: tilt the active sleeve toward sectors and stocks that are showing stronger relative performance signals, rather than keeping the same weights by default.
-
Stay diversified while tilting: limit selection to a small number of names per sector (top 3) so the overlay remains spread out rather than concentrated in one theme.
-
Keep the portfolio executable: only take positions in liquid stocks from the fund’s holdings, so changes in allocation remain practical to implement.
-
Manage downside actively: apply layered risk management so the overlay can reduce risk during unstable conditions instead of holding through every drawdown.
This is the core idea behind “PLUS”: the universe stays anchored to the fund, but the allocation is adjusted systematically with the goal of outperforming the fund over full cycles.
Testable predictions
Before looking at any final results, we wrote down what we would expect to see if the “PLUS” overlay is genuinely adding value (and not just getting lucky in a short window). These expectations became our checklist for later sections.
-
Ranking separation (does the overlay pick better names?): the stocks and sectors favored by the overlay should, on average, outperform the lower-ranked alternatives within the same fund holdings universe.
-
Consistency across time (is it repeatable?): the overlay’s edge should show up across multiple sub-periods, not depend entirely on one brief stretch of the backtest.
-
Net-of-cost survival (is it real after trading costs?): the strategy should still hold up after including realistic fees/brokerage/costs assumptions—otherwise the edge is not practically usable.
-
Diversified sources of return (is it more than one hidden bet?): outperformance should not be explained by a single sector or one narrow exposure. With a top-3-per-sector discipline, we expect contributions to be spread rather than dominated by one theme.
-
Improved drawdown behavior (does risk management help?): compared to pure mirroring, the risk framework should reduce the depth and/or duration of the worst drawdowns, even if it sometimes gives up a bit of upside in calm periods.
Industry Research: Tracking Products & Benchmarking
Tracking landscape
Before building NSCP, we looked at what “tracking” exposure to this segment usually means in practice.
At the center of that landscape is the Nippon Small Cap mutual fund itself: an equity scheme designed for long-term capital appreciation by investing predominantly in small-cap equities, with some flexibility to hold other instruments (for example, for liquidity and cash management). The simplest way to get this exposure is to simply own the fund (or an equivalent small-cap fund).
Alongside funds, there are also index-based references (small-cap indices) that represent a rules-based small-cap basket. In the real world, most “tracking-like” options—whether funds or index-referencing products—face similar practical constraints:
-
Category anchor (must stay meaningfully small-cap): Small-cap funds are expected to keep the majority of assets in the small-cap bucket, which limits how much they can shift into larger stocks even when parts of the small-cap universe look overheated.
-
Liquidity is a first-order constraint: Small-cap stocks can be harder to enter/exit at scale without impact. This affects how quickly a portfolio can be repositioned during stress and is one reason small- and mid-cap portfolios are often discussed in terms of liquidation/stress capacity.
-
Capacity management: When inflows into a small-cap strategy get too large relative to liquidity, fund houses may restrict new subscriptions or apply limits to manage capacity and protect existing investors.
-
Diversification discipline shaped by tradability: Position sizing and diversification are often constrained not just by “risk theory,” but by what can be traded reliably in the underlying names.
This landscape mattered because NSCP is intentionally built on top of the fund’s holdings: we wanted the familiarity of a tracking-like core, but we also wanted a structured way to adapt within the same investable universe—without ignoring the liquidity and category realities that small-cap products have to live with.
Benchmark choice (v1)
In the earliest backtests, we compared NSCP against NIFTY 50. This was not an intentional “best benchmark” choice for the product—rather, it was the practical default available at the time because the Nippon Small Cap Fund’s own equity curve (or a direct fund proxy) was not yet available on Wizzer.
Using NIFTY 50 gave us a basic sanity check: it let us see how the strategy behaved relative to a broad, liquid market index and helped us validate early questions around risk controls, drawdowns, and whether the overlay was doing something meaningfully different from a generic market exposure.
However, it also came with an important limitation: NSCP is built to track and outperform the Nippon Small Cap Fund, so measuring success against NIFTY 50 is only loosely informative. It does not directly answer the product’s main question: are we adding value versus the fund we’re anchored to?
Benchmark evolution (later)
Once the Wizzer team made the Nippon Small Cap Fund equity curve available for backtesting, we updated the benchmark to reflect the real objective: outperforming the fund itself.
From that point on, the benchmark comparison became much more meaningful for two reasons:
-
It aligned the evaluation with the product’s purpose (beat the fund, not the large-cap market).
-
It allowed us to judge whether the “PLUS” overlay was improving outcomes net of the same base exposure we were mirroring.
To keep the narrative fair and easy to interpret, we treat the benchmark shift as a data-availability milestone:
-
Early iterations are sometimes shown versus NIFTY 50 for continuity (what we could measure then).
-
The final acceptance of the strategy is judged versus the Nippon Small Cap Fund once that benchmark became available.
This benchmark evolution is part of the case study because it reflects a common reality in quant product development: sometimes the right benchmark exists conceptually from day one, but your ability to test against it depends on what data pipelines are available at the time.
Strategy Architecture
Universe construction
NSCP’s investable universe is intentionally constrained to what the underlying fund already owns.
-
Starting universe: The strategy builds its universe from the Nippon Small Cap Fund’s disclosed equity holdings. The same holdings set powers both the core mirror sleeve and the active overlay.
-
Liquidity discipline: We only take positions in liquid names from this list, so the strategy remains practical to implement (especially important when the underlying names include small caps).
-
Market-cap mix is inherited from the fund: While the fund is a “small cap” strategy by mandate (and is majority small cap), it can still hold a mix of stocks across market caps. NSCP does not add an extra market‑cap cutoff on top of the fund — it inherits the fund’s composition.
Signal design and risk layers
The “PLUS” comes from a rules-based overlay that tries to reallocate toward the parts of the fund’s universe that are showing stronger return potential, while actively controlling downside.
Sector rotation (where leadership is forming)
Each week, we evaluate a set of sector indices and identify the sectors that are behaving like leaders — i.e., sectors whose relative strength is improving and whose momentum is positive. This produces a shortlist of sectors where returns are currently concentrating.
Factor tilt (which stocks inside those sectors look strongest)
Within the shortlisted sectors, we score eligible fund-holdings using a multi-factor lens that includes:
-
Momentum: preference for stocks with stronger medium-term trend.
-
Value: preference for stocks that look cheaper on common valuation measures.
-
Quality: preference for financially stronger businesses.
-
Low volatility: preference for more stable return profiles.
-
Size: a systematic way to differentiate across market caps within the fund’s holdings.
-
Institutional participation: preference for names with healthier institutional ownership / participation signals.
The active overlay then selects a limited number of the highest-scoring stocks.
Stock-level risk management (active sleeve)
NSCP uses multiple “early warning” exits to reduce exposure when a stock looks unstable or overextended:
-
Volatility-aware sizing: risk is scaled down in more volatile names so the overlay doesn’t accidentally concentrate risk in a few unstable stocks.
-
Statistical overextension exits (“sigma exits”): if a stock moves far beyond its normal recent trading range, we treat it as overextended and reduce risk rather than assume the move will continue.
-
Momentum crash / decay checks: we monitor conditions that can cause momentum-style strategies to break down during sharp market stress and can cut exposure when those conditions appear.
-
Persistent downtrend detection: we distinguish between a one-day dip and a sustained negative drift; if a downtrend looks persistent, we exit instead of waiting for a full drawdown.
-
Intraday free‑fall exits with bounce re‑entry: on 5-minute data, we detect sharp “self-reinforcing” selloffs in individual stocks and exit quickly; if the stock stabilises and shows a statistically meaningful bounce, we allow a structured re-entry.
Portfolio-level risk management
In addition to single-stock exits, NSCP includes a portfolio-level safety layer designed for systemic shocks:
-
Turbulence / tail-risk kill-switch: when conditions look unusually stressed at the market level, the strategy can step aside to cash.
-
Structured re-entry: after stepping aside, we require a confirmed stabilisation regime before fully reallocating back into the strategy, to avoid whipsaws.
Portfolio construction and rebalancing
NSCP is implemented as a two-sleeve portfolio with explicit constraints.
-
Core mirror sleeve (60%): mirrors the fund’s holdings and weights to keep exposure anchored to the fund.
-
Active overlay sleeve (40%): invests in a selected subset of the same holdings universe based on sector leadership + factor tilt.
Constraints and diversification
-
Per-stock cap: a single stock is capped at 4% of total portfolio value.
-
Sector diversification rule: the overlay is limited to top 3 stocks per sector, to prevent concentration in a single theme.
-
Liquidity constraint: positions are taken only in liquid stocks from the fund’s holdings.
Rebalancing and monitoring cadence
-
Weekly rebalance: every week (Friday afternoon), we recompute sector leadership, rescore stocks, refresh the active list, and rebalance the overlay.
-
Between rebalances: risk is monitored via daily checks and intraday monitoring for the active sleeve, so exits can happen when risk triggers occur — not only on rebalance days.
Implementation in Wizzer
A large part of NSCP’s journey was not just about refining the strategy logic—it was about making sure the right data and platform plumbing existed to build and test it properly.
When we first began moving NSCP from a strategy document into an executable strategy on Wizzer, three key inputs were not available:
-
Fundamental data required for the factor-based stock selection layer.
-
NIFTY sector and factor index OHLCV, along with their index constituents/components, required to rank sectors and apply factor lenses.
-
An API for Nippon Small Cap Fund holdings (so the strategy could reliably mirror the fund and use the fund’s holdings as its investable universe).
What enabled the first build
Wizzer first shipped the foundations required for NSCP’s active overlay:
-
the missing fundamental dataset, and
-
OHLCV data for NIFTY sector and factor indices, along with their components.
This allowed us to implement the sector ranking and factor selection logic as described in the strategy design.
The holdings gap (and the workaround)
Even after the above, we still did not have an API for the fund’s holdings.
To unblock implementation and start validating the strategy operationally:
-
we hardcoded the fund’s holdings, and
-
deployed the first paper-trading version on Wizzer.
The LEAN shift (and the missing API)
After we adopted QuantConnect LEAN, Wizzer built the missing fund holdings API. That removed the last major dependency and allowed us to run a clean backtest where the strategy could mirror the fund using actual holdings data.
Backtest Setup
The first full backtest on Wizzer used a 6‑month window.
A practical detail mattered here: benchmarking.
-
In the earliest runs, the benchmark was NIFTY 50 (default), because the Nippon Small Cap Fund equity curve was not available on Wizzer.
-
Once Wizzer provided the fund equity curve, the benchmark comparison shifted to the Nippon Small Cap Fund, which is the real objective of the product.Results + Failure Analysis
Where to insert the two backtest snapshots (single place)
Insert both snapshots in this section, because this is where we present the evidence that triggered iteration and show the improvement after simplification.
-
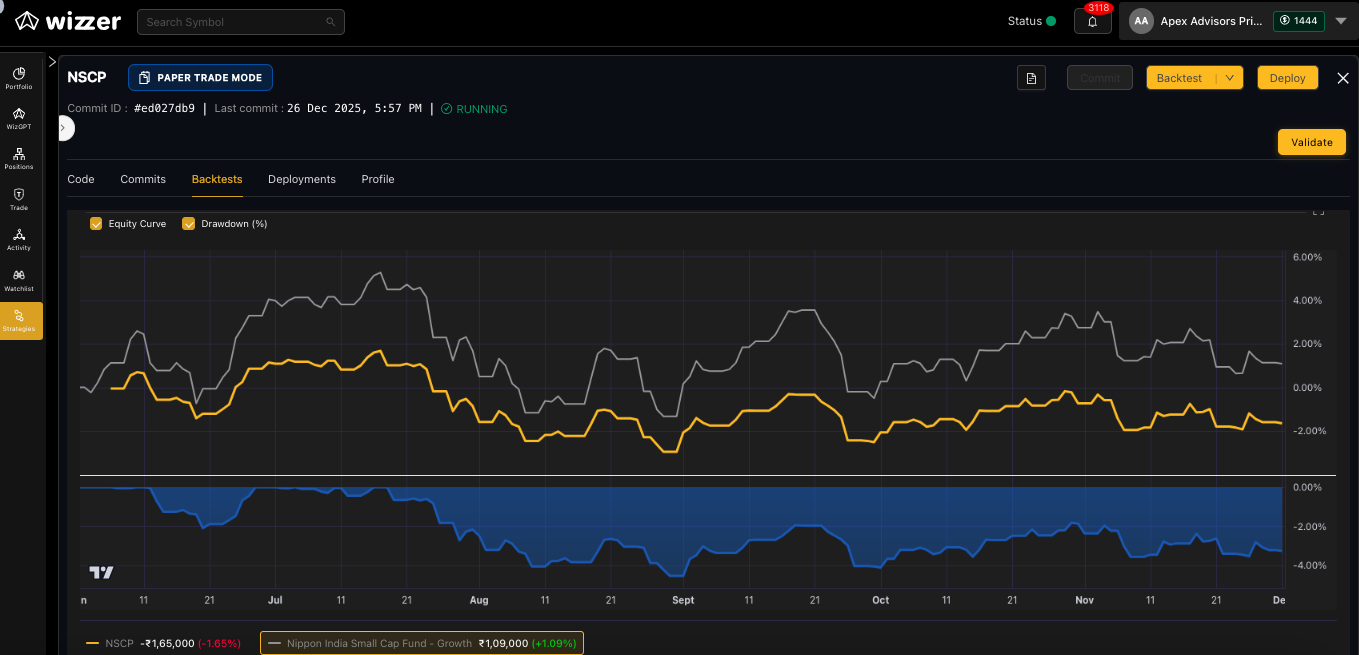
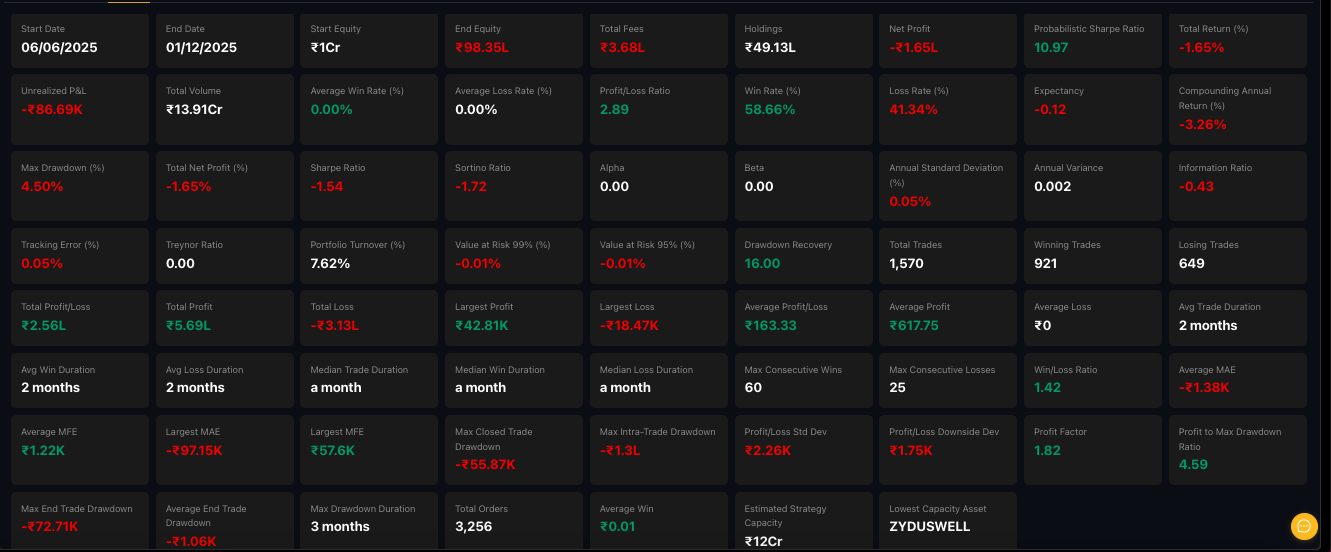
Snapshot 1: First 6‑month backtest (the version that returned -1.65%) — include the equity curve vs benchmark and the summary metrics.
-
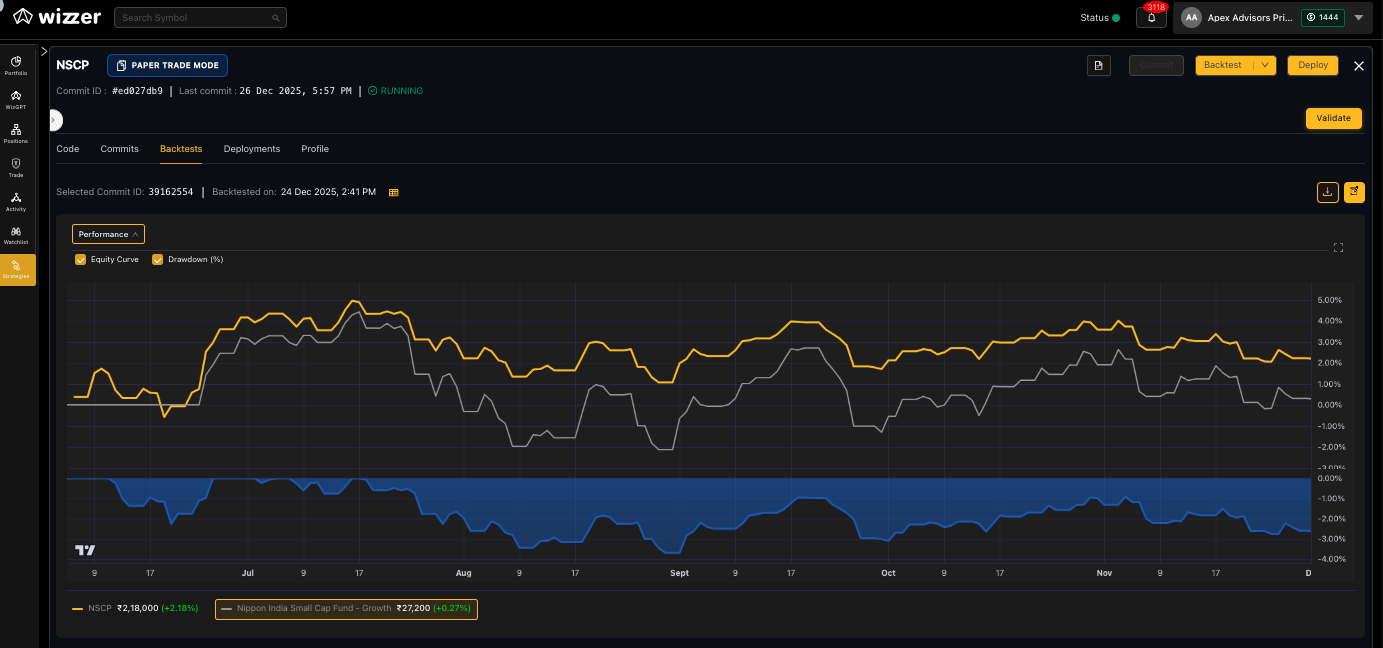
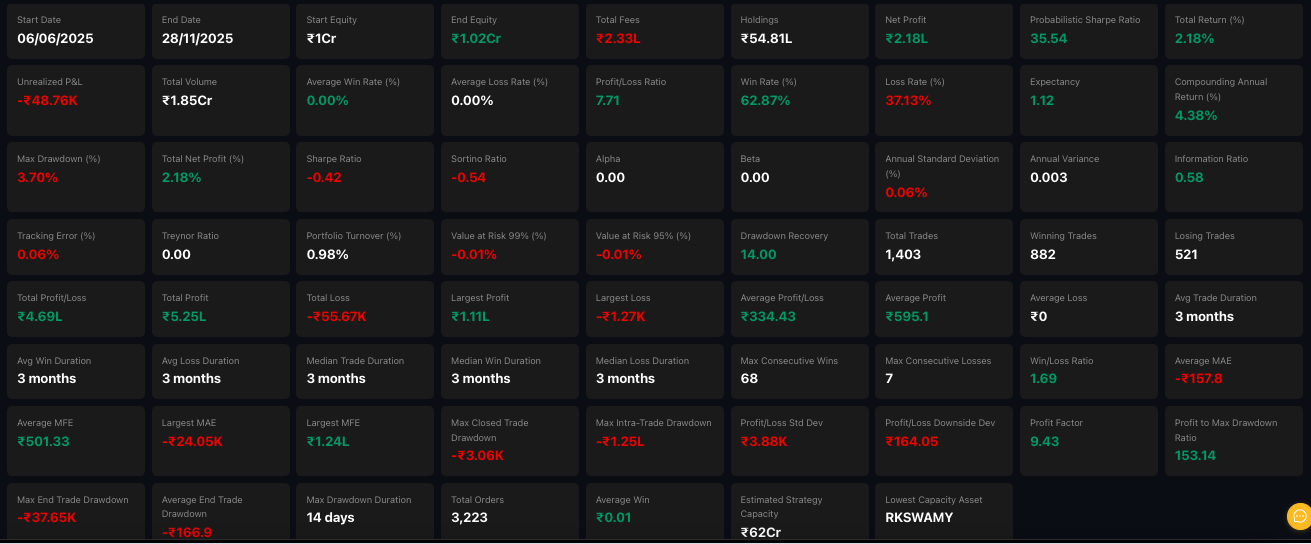
Snapshot 2: Simplified 6‑month backtest (the version that returned +2.18% and beat the fund) — include the equity curve vs benchmark and the summary metrics.
First backtest result (6 months)
The first backtested implementation on Wizzer produced:
- -1.65% total return over 6 months.
This outcome did not meet the core design objective (outperforming the fund), and it triggered the first major iteration after seeing results.
The first simplification iteration
The next step was a deliberate simplification: the researcher removed three components from the strategy:
-
Page‑Hinkley
-
Free‑fall exit
-
Volatility scaling (position sizing was changed to equal‑weight)
With those changes, the same 6‑month evaluation delivered:
- +2.18% total return over 6 months,
and this version beat the Nippon fund over that window.
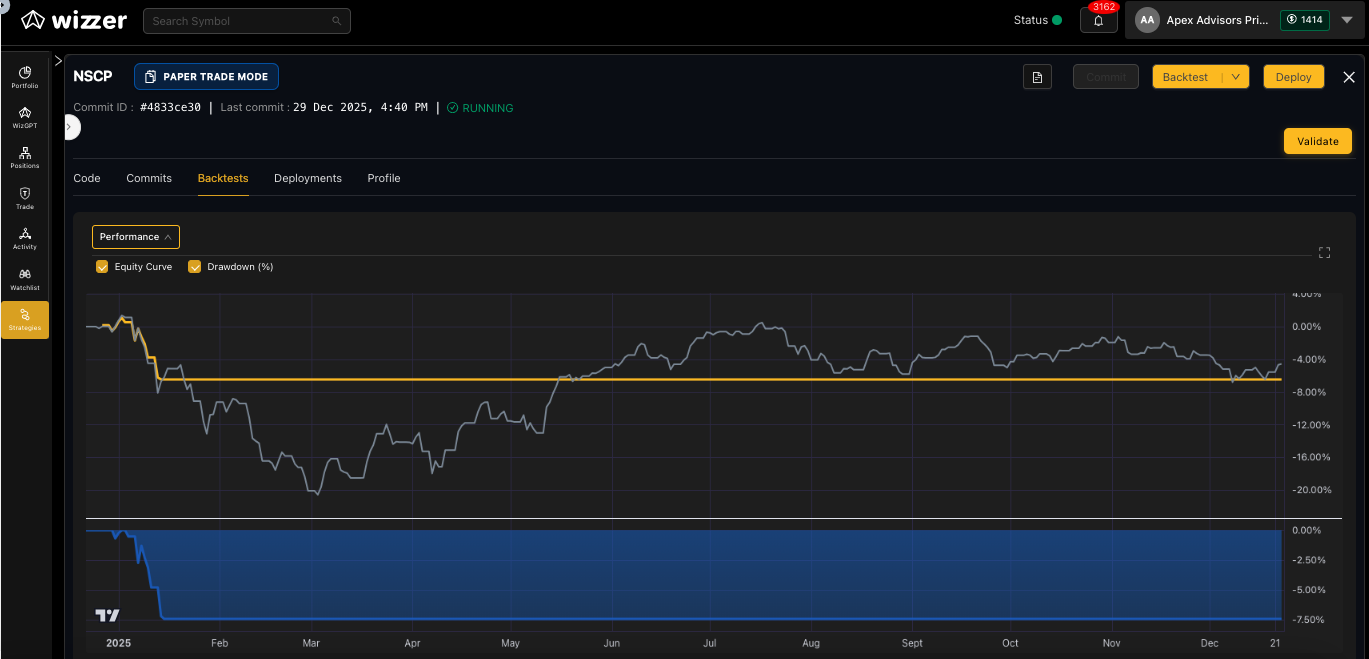
When backtested for 1 year
When the simplified version was backtested for one year, the portfolio hit a 5% drawdown mark which liquidated the entire portfolio and as we removed the Page‑Hinkley re-entry in the previous iteration there was no re-entry so we got a flat line after the liquidation.
Takeaway from the first backtest cycle
The first backtest cycle highlighted a common lesson in systematic strategy development: more layers and more signals do not automatically improve outcomes. Sometimes the most productive iteration is to simplify, retest, and only reintroduce complexity if it consistently earns its place.
Iteration Log (v1 → v2)
Change log table
This table summarises the strategy’s short version journey and the key platform milestones that unlocked each step.
v0 → v2 (keep short)
| Version | Stage | What changed (high-level) | Why it mattered |
|---|---|---|---|
| v0 | Strategy design (pre-code) | Initial concept: mirror fund + PLUS overlay | Defined the product shape (core + overlay) |
| v1 | Strategy refinement (pre-code) | Iterated rules around factor/sector ranking + risk layers | Improved idea quality before building pipelines |
| v2 | First executable version | Deployed via Wizzer with hardcoded fund holdings (no holdings API yet) | Enabled paper trading despite data gaps |
| v2 (backtest) | First backtested build on Wizzer | After adopting LEAN, Wizzer shipped a fund holdings API → enabled backtest | First measurable performance: -1.65% (6M) |
| v2 (simplified) | Post-research refinement | Dropped Page‑Hinkley, Free‑fall exit, and changed vol scaling → equal‑weight | Improved to +2.18% (6M); beat fund |
Iteration 1 (detail): First backtested implementation (v2) and what we learned
After adopting LEAN and getting access to the fund holdings API, we were able to run the first clean 6‑month backtest of NSCP on Wizzer using the strategy rules captured in v2.
What we tested (v2):
-
NSCP running as designed (core mirror + active overlay with all intended selection and risk layers).
-
Benchmark comparison aligned to the product’s objective (vs the Nippon Small Cap Fund, once the fund equity curve was available).
Outcome (6 months):
- The backtest returned -1.65%.
This was an important checkpoint because it was the first time NSCP could be evaluated end‑to‑end against the right reference. The result did not meet the product’s primary objective (outperforming the fund), so we treated it as a signal to reassess what parts of the overlay were helping and what parts might be adding friction or noise.
Decision after Iteration 1:
-
Keep the overall product structure (core mirror + overlay) intact.
-
Run a focused simplification experiment to test whether removing certain layers improves net performance and stability.
Iteration 2 (detail): Simplifying the overlay and retesting
The next iteration was a deliberate simplification of the active overlay. Instead of adding more rules, we removed a few that were most likely to increase churn or prematurely interrupt positions—then re-ran the same 6‑month evaluation.
What changed (v2 → v2 simplified):
-
Dropped Page‑Hinkley (bounce / re‑entry logic).
-
Dropped Free‑fall exit (intraday sharp‑drop exit layer).
-
Dropped Volatility scaling, and moved the active overlay to equal‑weight sizing.
Why these changes were reasonable to try:
-
Fewer moving parts: With multiple exit / re‑entry layers active at the same time, strategy behavior can be dominated by short-term triggers rather than the intended selection thesis.
-
Reduced sensitivity to short-term noise: Intraday “free‑fall” exits and bounce re‑entries can be helpful in principle, but they can also create unnecessary exits and re‑entries during volatile stretches.
-
Clearer expression of the selection thesis: Switching from volatility scaling to equal‑weight sizing makes the overlay simpler to interpret and ensures each chosen stock actually contributes meaningfully (instead of some positions being down‑weighted enough to matter less).
Outcome (6 months):
-
The simplified version returned +2.18%.
-
Over the same period, this version beat the Nippon Small Cap Fund.
Decision after Iteration 2:
-
Treat the simplified version as the new baseline for e next stage of validation.
-
Only reintroduce additional layers later if they can demonstrate consistent improvement (not just conceptual appeal).
Wizzer Updates That Accelerated NSCP
A major part of NSCP’s iteration speed came down to whether the platform could reliably run long, data-heavy backtests without breaking. Early in the journey, this was a real constraint.
What improved in workflow
In the initial backtesting runs, the strategy’s data load and computation load were high enough that backtests would often time out before completing. This made it hard to get stable outputs, diagnose issues, and iterate meaningfully.
Wizzer helped us unblock this in two ways:
-
Increased backtest timeout limits: The platform extended the maximum time a backtest could continue running on the server, so longer runs had a chance to complete.
-
Code/performance optimisations: The backtest implementation was optimised so that runs became smoother and more reliable, instead of failing mid-way due to resource bottlenecks.
The practical impact was simple: we could finally get complete backtest runs with usable results, which is what made the next strategy improvements possible.
What we re-tested because of these updates
Once backtests became reliable and could run end-to-end, we re-ran the NSCP backtest workflow to get stable outputs that we could inspect and use for iteration.
This specifically enabled:
-
A complete 6‑month backtest run for v2 (the first measurable result we could diagnose).
-
A clean re-run after simplification (so we could compare outcomes under the same conditions and validate whether the changes improved performance).
Current Backtesting Status + Remaining Issues
We are still in the process of finalising NSCP. The long-term goal is to beat the Nippon Small Cap Fund across multiple timeframes, but the most recent completed evaluation we have today is a 6‑month backtest.
At the time of writing, Wizzer is continuing to optimise infrastructure so longer, data-heavy backtests can run flawlessly end‑to‑end (without timeouts). As those longer runs become feasible, this section will expand to include multi-year validation.
Backtest setup used for the completed runs
Once the fund holdings API existed (post‑LEAN), we could run a clean backtest on Wizzer where NSCP mirrored the fund using actual holdings data.
-
Backtest window: 6 months
-
Benchmark: Nippon Small Cap Fund (after the fund equity curve became available)
Remaining issues (what still needs validation)
Even though the 6‑month results gave us a concrete checkpoint, this window is not long enough to conclude that NSCP reliably outperforms across regimes. The remaining work is mainly about validation depth.
-
Timeframe coverage: We still need longer backtests (multi‑year) to judge whether the overlay’s edge persists.
-
Regime coverage: A longer sample should include more varied market environments to see how the risk controls behave.
-
Stability of conclusions: We need to confirm that the “beat the fund” outcome is not overly dependent on one short period.
Best Completed Backtest So Far (6 months)
Headline outcomes
The first positive “release-candidate” style result came after simplifying the strategy by removing three components and switching position sizing to equal‑weight.
-
Changes: removed Page‑Hinkley, removed Free‑fall exit, changed volatility scaling → equal‑weight sizing
-
Backtest window: 6 months
-
Outcome: We are able to outperform the fund by roughly 2% across the 6-month period
Attribution (to add when longer runs are available)
If you have sleeve-level or sector-level breakdowns from Wizzer exports, this is where you’d show where the 6‑month outperformance came from (core vs overlay contribution, sector contribution, and whether returns were concentrated in a small subset of names).
Robustness checks (next step, not completed yet)
The 6‑month result is a useful checkpoint, but robustness requires longer samples. As Wizzer enables longer backtests, we will expand validation to include multi-year runs and sub-period checks.
Monitoring Plan (what we’ll track once NSCP is live)
When NSCP is deployed beyond backtesting, we’ll monitor the strategy’s behaviour so we can detect drift, breakdowns, or risk build-up early.
What we monitor
-
Relative performance vs the fund (rolling windows)
-
Drawdown depth and recovery time
-
Turnover and churn in the overlay
-
Sector concentration (is the overlay behaving as diversified as intended?)
-
Liquidity posture (are we staying within liquid names as planned?)
V3 triggers (when we iterate again)
-
If relative performance vs the fund stays negative for a sustained window
-
If drawdowns exceed what we consider acceptable for the product objective
-
If the overlay becomes overly concentrated (by sector or a small number of names)
-
If operational constraints (data, backtest reliability) change what’s feasible
My Next Steps for NSCP
What I plan to do next is to strengthen NSCP’s drawdown recovery behavior so the strategy doesn’t “exit and stay out” after a risk-off move. In the next iteration, we’ll incorporate a more structured re-entry framework built from historical drawdown patterns (using long-history index drawdowns as a reference for typical depth and duration), and then re-run a longer backtest to evaluate whether this improves continuity of participation after a defensive exit. The goal is simple: keep the same discipline on risk control, but make the strategy’s path back into the market more systematic—so we can judge the next version on the same criteria we’ve used throughout this case study: robustness, realism, and the ability to stay competitive versus the fund over meaningful horizons.
Watch out for our next blog where we try to outperform the fund over larger horizons.