Research and Background
Relative performance cycles and the intuition for buying laggards
Even inside a broad index like the NIFTY 50, stocks rarely move together. At any point, a few names lead, a few lag, and many rotate in and out of favour. That dispersion is driven by a mix of fundamentals (earnings cycles, margins, balance-sheet changes) and non‑fundamental forces (positioning, sector flows, ETF/index rebalances, and narrative shifts).
A simple but powerful idea follows from this: relative underperformance is often cyclical. Stocks that fall behind the index can sometimes be pricing in a temporary headwind and if that headwind fades, performance can normalise through a catch‑up phase.
This catch‑up behaviour sits under the broader umbrella of mean reversion: after prices (or relative returns) become unusually stretched, they can drift back toward more typical levels.
But it’s important to be precise: mean reversion is not “buy the weakest stock and wait.” Underperformance can be temporary… or it can be the market correctly repricing structural deterioration. That’s why the real research question for a systematic strategy becomes:
How do we identify laggards where underperformance is likely temporary, and avoid the names where weakness is persistent?
The sections below build up that answer step by step — first from what academic work says about reversals, then by introducing the risk-control logic that helps contrarian ideas stay investable.
What the literature says about reversals and “losers”
Evidence for reversal-type behaviour shows up across horizons — and the key message from the research is that extremes tend to be informative.
At long horizons, the standard behavioural evidence is De Bondt & Thaler (1985), “Does the Stock Market Overreact?”. They show that the market can push extreme past losers (and winners) too far, and that a portion of that move can unwind over time, consistent with the idea that investor sentiment and narrative swings can overshoot before correcting.
At shorter horizons, researchers have also documented predictable components in returns consistent with contrarian effects. Jegadeesh (1990), “Evidence of Predictable Behavior of Security Returns” finds that very short-term returns are not purely random, and that some patterns look like short-term reversal rather than continuation. Lehmann (1990), “Fads, Martingales, and Market Efficiency” similarly finds evidence consistent with contrarian profits — suggesting that after sharp moves, prices can “cool off” and retrace, especially when the move was driven by pressure rather than lasting information.
A related macro perspective appears in Poterba & Summers (1988), “Mean Reversion in Stock Prices: Evidence and Implications”. Their work frames mean reversion as a feature of how expected returns and valuation adjust over time, reinforcing the intuition that periods of relative weakness can be followed by catch-up, even if the path is noisy.
The useful takeaway for strategy design isn’t that reversals are guaranteed. It’s that reversal-like behaviour has been documented repeatedly, and it tends to be most visible around extremes — which is exactly why a systematic framework starts by measuring who lagged, by how much, and whether the weakness looks temporary or structural
1.3 Why laggards can catch up: benchmarking, earnings cycles, and “limits to arbitrage”
Relative underperformance isn’t always a sign of a broken business. Very often, it’s the result of how markets and portfolios are organised.
One driver is benchmarking and institutional constraints. Many investors are evaluated versus an index, which creates career and tracking‑error risk: it’s hard to hold “unpopular” laggards while they’re falling, even if the long‑term story is intact. This is a classic example of limits to arbitrage — rational investors may avoid mispricings because the path to correction can be painful. Shleifer & Vishny (1997), “The Limits of Arbitrage”is widely cited for explaining why mispricing can persist when capital is constrained.
A second driver is extrapolation. Markets often over‑penalise stocks after a bad patch by assuming recent weakness will continue indefinitely. Contrarian/value research such as Lakonishok, Shleifer & Vishny (1994), “Contrarian Investment, Extrapolation, and Risk”argues that investors tend to over‑extrapolate past growth/decline, and that portfolios built from “out of favour” names can earn higher subsequent returns.
Finally, there are flow mechanics: quarter‑end positioning, sector/style rotation, and passive flows can create stretches of underperformance that later normalise once the forced selling or crowding unwinds.
The practical takeaway for this strategy style is not “buy the biggest losers.” It’s that laggards can be temporarily cheap or temporarily avoided, and a systematic approach can look for the subset where weakness is more likely to be cyclical than structural.
1.4 Why we add a trend filter: avoiding value traps and “falling knives”
If reversals exist, why not just buy the worst performers? Because the worst performers often include structural losers.
This is where the trend-following and time-series momentum literature is useful as a risk-control lens. Moskowitz, Ooi & Pedersen (2012), “Time Series Momentum”shows that simple trend rules applied across markets have historically delivered positive performance, which is consistent with the idea that markets can exhibit persistence once a move becomes established.
Similarly, long-run evidence for trend-following across many markets is documented in Hurst, Ooi & Pedersen (2017), “A Century of Trend-Following Investing”. The conceptual takeaway is not that trend-following is “better” than mean reversion — it’s that trend state contains information.
So we treat trend as a filter:
Underperformers are candidates — but we only act when price behaviour suggests the stock has shifted back into a healthier direction (i.e., recovery momentum is present).
Strategy construction
This section explains how we’ve built a long-term, systematic buy-and-hold rotation strategy that targets controlled underperformers in the NIFTY 50, while using simple momentum confirmation to avoid buying weakness blindly.
Universe and benchmark
The investable universe is the NIFTY 50, using dynamic (point-in-time) index membership so the strategy only trades what was actually in the index at that time. The benchmark for relative comparisons is the NIFTY 50 index itself, which acts as the reference return stream for identifying “underperformance.”
The core idea: find laggards, then wait for stabilisation
The strategy follows a simple quarterly rhythm. Each cycle, we measure which NIFTY 50 stocks lagged the index over a recent window and form a candidate set of underperformers. Instead of chasing the worst collapses, the framework is designed to focus on laggards where underperformance looks more likely to be cyclical than structural.
Entries are not taken immediately on “cheapness” alone. The process waits for evidence that the stock has stopped deteriorating and started stabilising, using a light-touch confirmation layer so the strategy is not blindly averaging down.
Portfolio construction
From the eligible names, we build a diversified basket with systematic sizing and sensible caps so the portfolio does not become overly concentrated. The goal is a portfolio that is easy to implement, avoids over-trading, and allows multiple independent catch-up moves to contribute to returns over time.
Risk controls and exits
Risk management is deliberately straightforward: positions are monitored daily with rule-based exits that (a) cut invalidations quickly, (b) take profits when a snapback becomes stretched, and (c) prevent positions from drifting into unintended long-duration exposures. The strategy also follows a periodic refresh cadence so the basket does not become stale.
Re-entry behaviour
The system can re-enter names over time, but only when they once again meet the underperformance + stabilisation logic. This keeps the strategy aligned with its core thesis catch-up from temporary lagging without turning it into constant churn.
Backtests
All backtests are implemented on Wizzer and are designed to mirror live constraints as closely as possible.
We explicitly enforce:
-
Point-in-time NIFTY 50 membership (no survivorship shortcuts)
-
Corporate-action adjusted data (splits/bonuses/dividends handled consistently)
-
Rule-consistent execution timing (quarterly refresh logic, daily checks, exits)
-
Fees and transaction cost assumptions aligned with realistic deployment
Evaluation focuses on both performance and implementability: benchmark-relative return, drawdown behaviour, turnover, concentration, and how the strategy behaves in different market regimes.
Outcomes
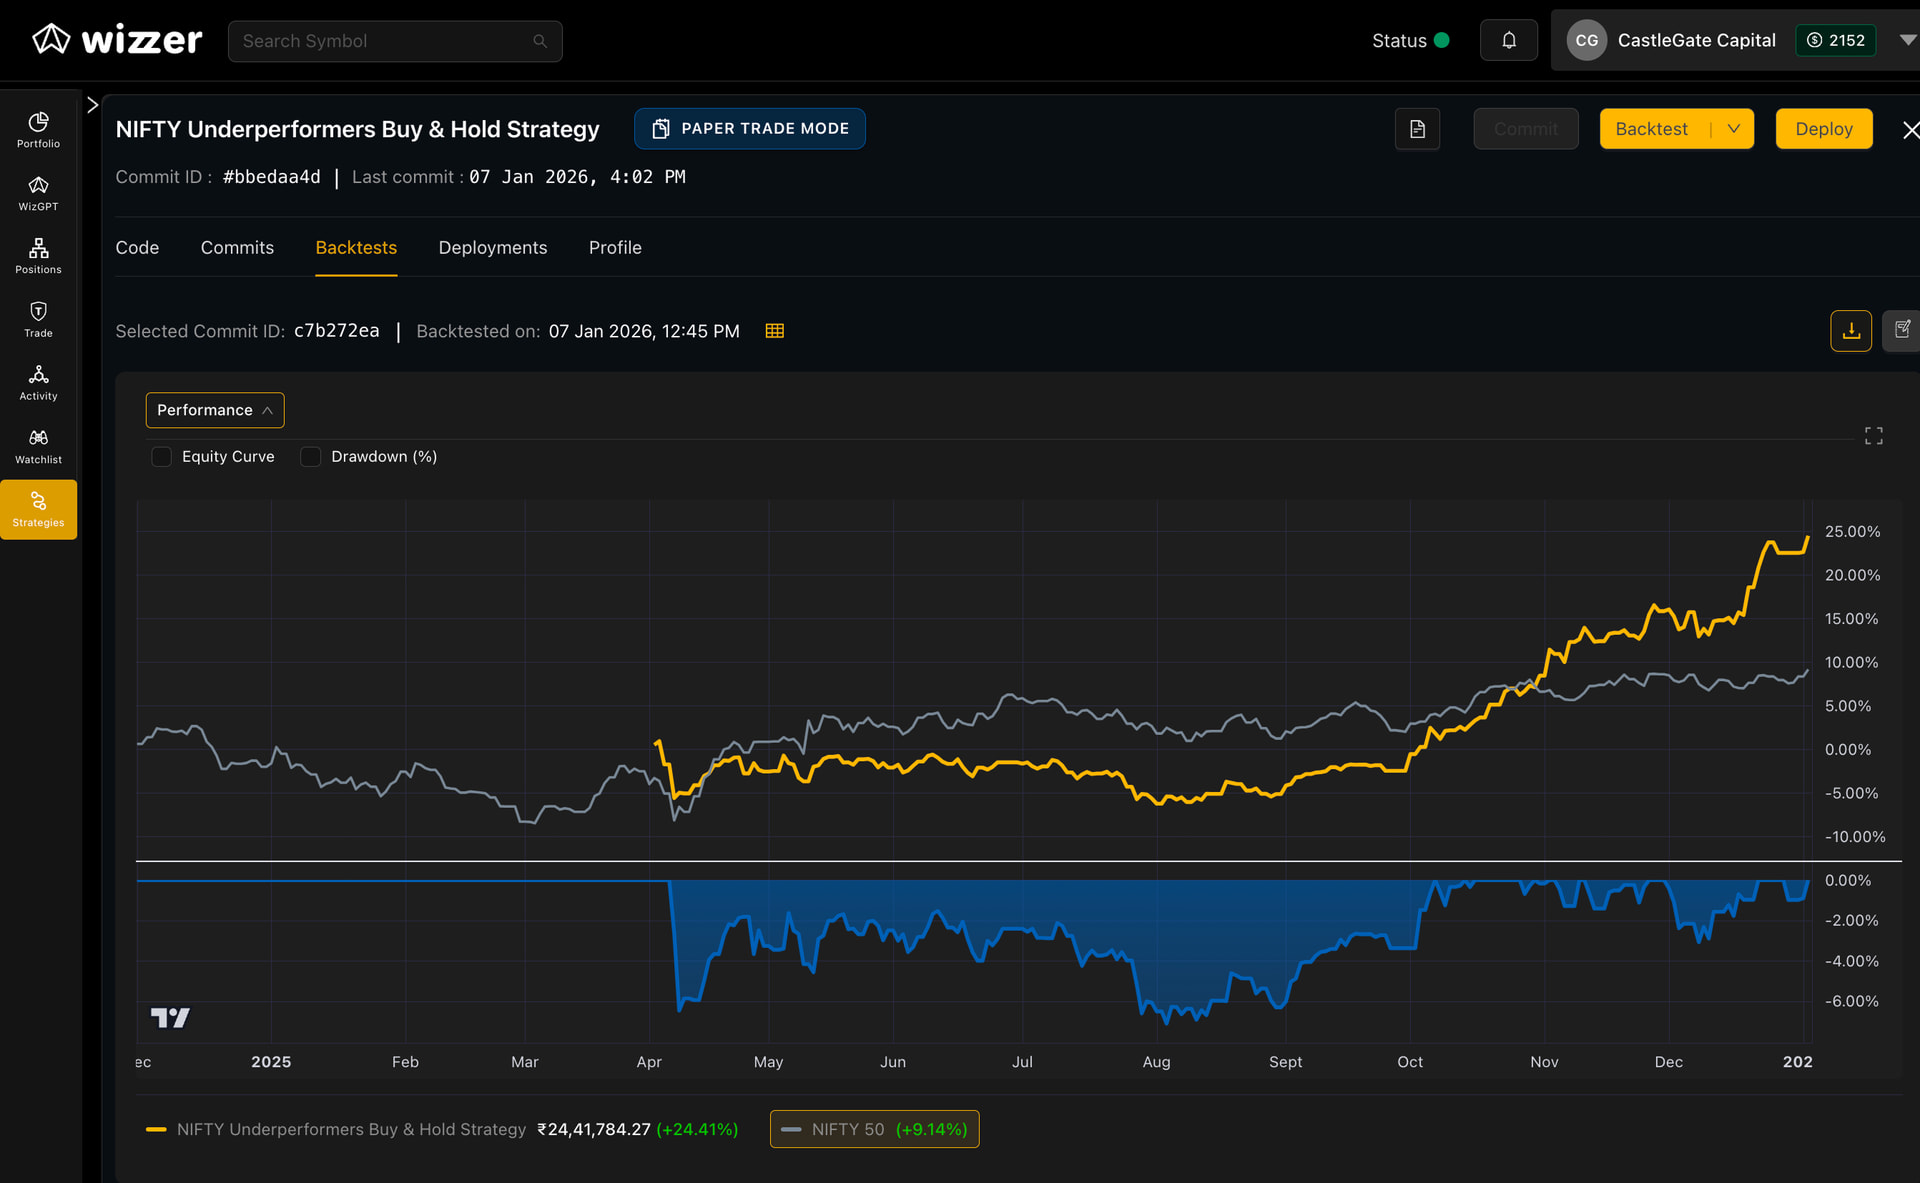
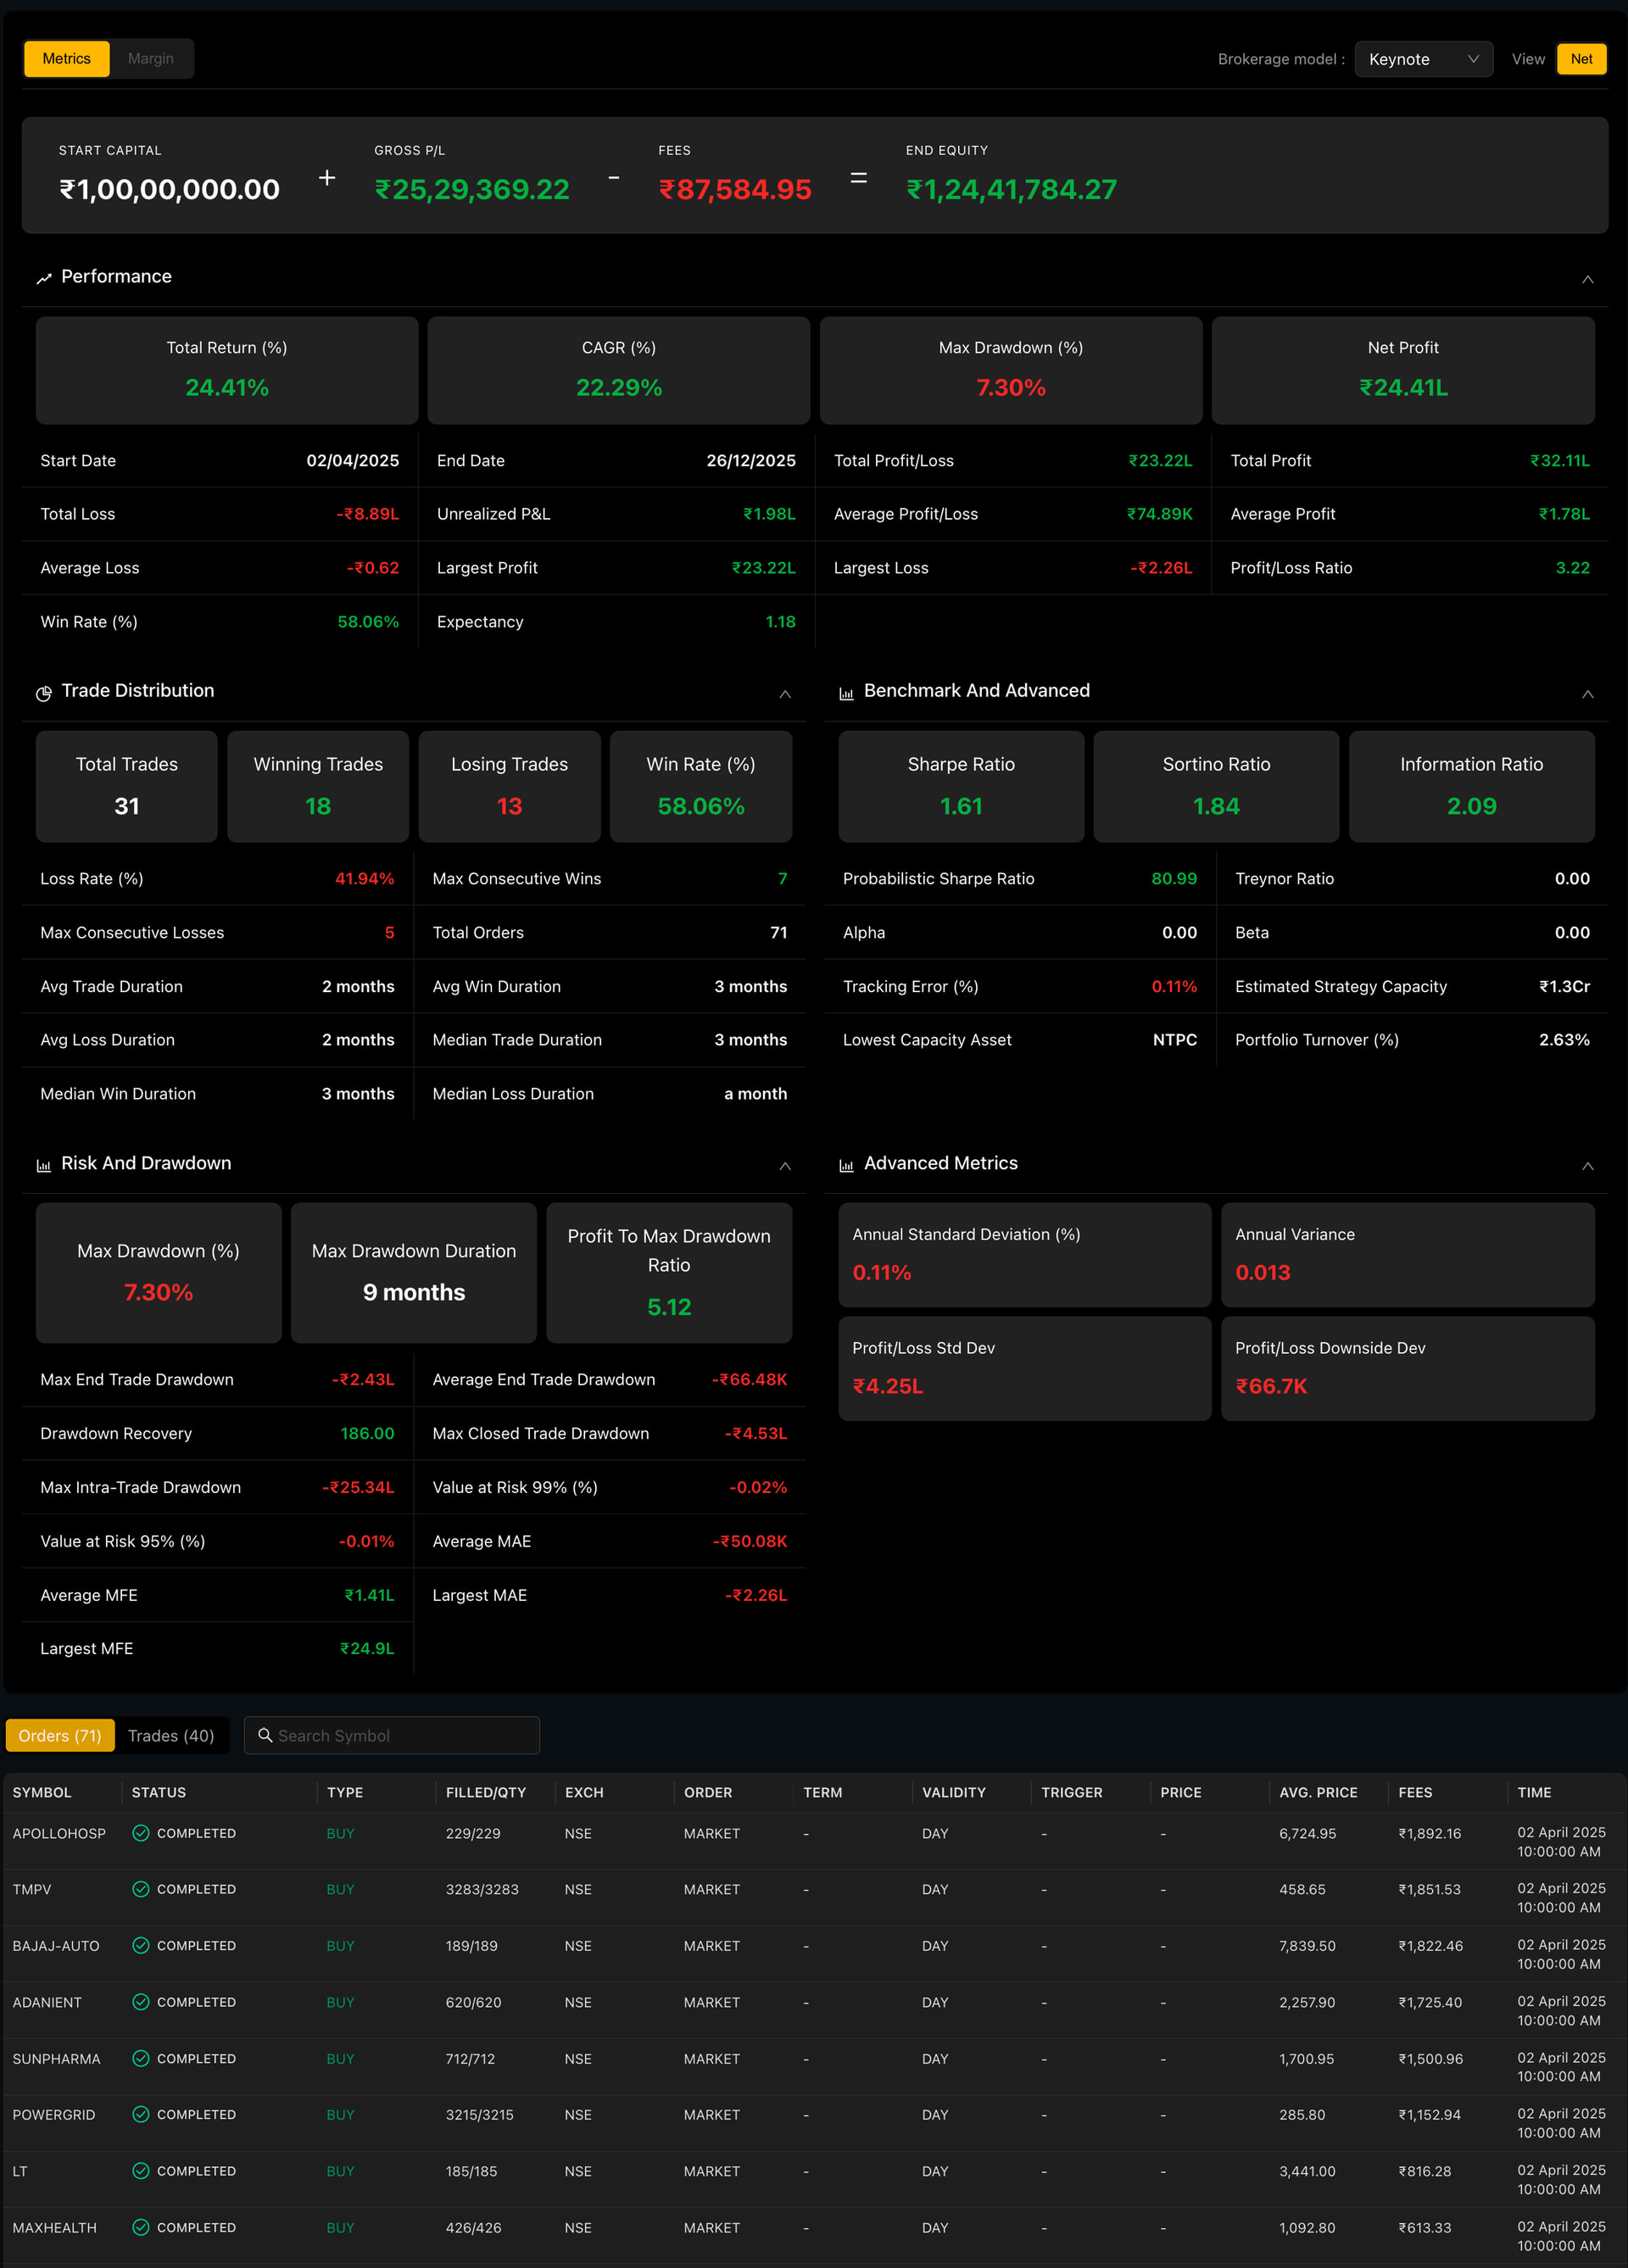
This backtest (02 Apr 2025 to 26 Dec 2025) shows a strong “catch‑up” profile: the strategy delivered +24.41% total return versus NIFTY 50 +9.14% over the same window.
A few numbers stand out on the risk/quality side:
-
CAGR ~22.29% with max drawdown ~7.30% (a relatively contained drawdown for the return delivered)
-
Sharpe ~1.61, Sortino ~1.84, and Information Ratio ~2.09 (good risk-adjusted performance and benchmark outperformance)
-
Profit-to-max-drawdown ratio ~5.12, indicating strong return per unit of peak drawdown
-
Low churn / long-term holding behaviour: only 31 trades in the period and ~2.63% portfolio turnover
Overall, the backtest supports the core thesis: a systematic process that focuses on temporary relative underperformance (with stabilisation discipline) can deliver meaningful index outperformance without requiring high turnover.
References
Our materials
-
Strategy Document
 Click to Open
 -
Research Paper Pack (Folder)
Click to Open
Contact us
If you’d like the full research pack, detailed backtest outputs, or a walkthrough of how we implement long-term systematic equity strategies on Wizzer, reach us on WhatsApp:
+91-8928065586