 Understanding Intraday Volatility Breakouts
Intraday markets often look noisy on the surface, but a closer look reveals a consistent theme: when volatility expands, price tends to move with it. This behaviour has powered some of the most reliable intraday models used by systematic traders, funds, and quantitative desks.
As a researcher at CastleGate Capital, I spend most of my time studying how volatility, structure, and liquidity interact during the trading day. One of the cleaner frameworks that repeatedly stands out is the volatility breakout approach — simple enough to understand, yet powerful enough to model and automate with precision.
 What Are Volatility Breakouts?
Markets typically oscillate within a narrow band during the initial part of the session. Occasionally, however, volatility increases sharply due to institutional activity, order‑flow imbalances, or macro catalysts. When this expansion happens, price breaks away from the opening structure and often sustains the move.
A volatility breakout framework identifies:
-
The day’s underlying volatility using recent price behaviour
-
A structured zone around the opening price
-
Breakout levels where price movement becomes meaningful
When these levels are crossed, the system isn’t predicting — it’s responding to the market’s own behaviour.
 Why Volatility Matters
Predicting direction is noisy. Identifying when the market is likely to move is far more reliable.
Volatility‑based models:
-
Avoid low‑energy, range‑bound environments
-
Trigger trades only during meaningful expansion
-
Keep risk anchored around predefined structural levels
This shifts the trader’s focus from guessing direction to assessing quality of movement.
 Core Principles Behind a Breakout Framework
1. The Opening Structure Matters
The open reflects overnight positioning, global cues, and liquidity. Defining risk around it brings consistency.
2. Volatility Guides Expectation
Metrics like ATR help quantify what a “normal” day looks like, letting the system spot abnormal moves.
3. Trades Only on Confirmation
Breakouts are validated only if price moves with intent — no anticipatory entries.
4. Intraday Discipline
Positions close the same day, either by structural invalidation or end‑of‑session, avoiding overnight uncertainty.
 Where the Edge Comes From
Volatility breakout systems have edge because they:
-
Capture real, measurable expansions in volatility
-
Align with intraday momentum bursts
-
Filter out low‑probability environments
-
Keep emotions out of the decision process
Markets rarely break key levels and immediately revert without some follow‑through. This behavioural tendency is what systematic breakout models exploit.
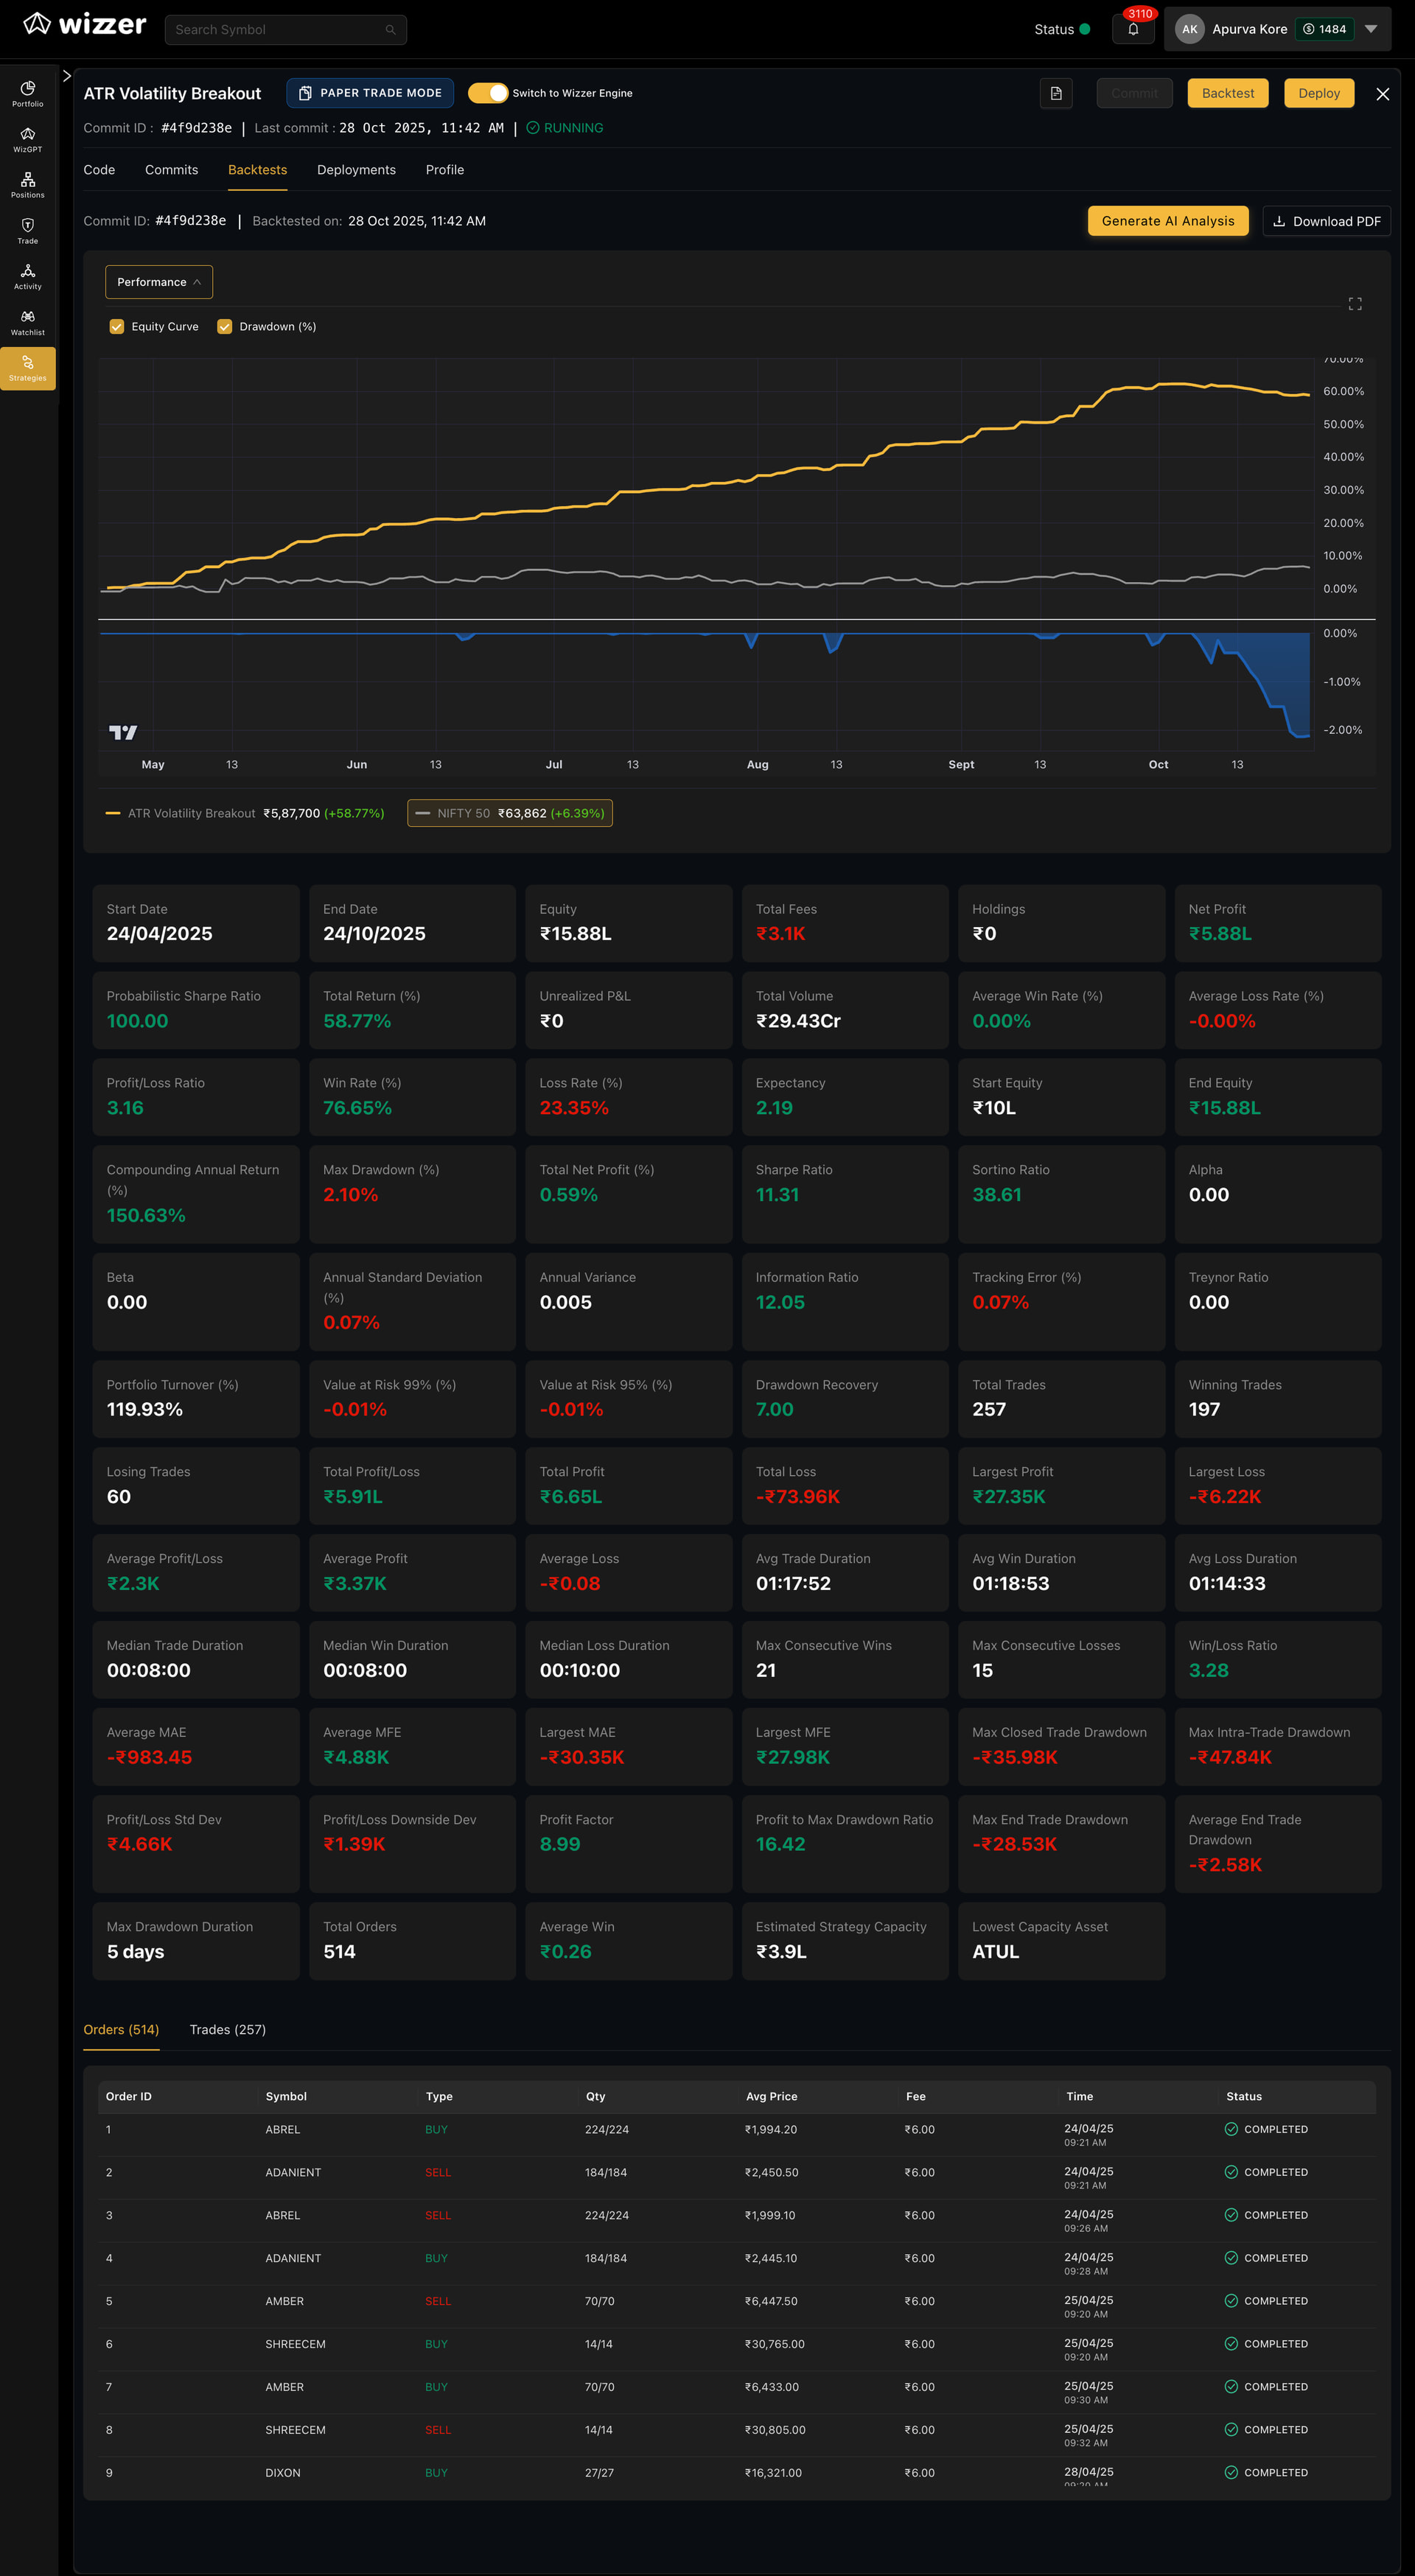
![]() ATR Volatility Breakout — Performance Snapshot
ATR Volatility Breakout — Performance Snapshot
From Apr–Oct 2025, the ATR Volatility Breakout model delivered +58.77% on a ₹10L base, with a Sharpe Ratio of 11.31 and a max drawdown of just 2.10%.
The system executed 257 trades, maintained a 76% win rate, and showed smooth, consistent compounding throughout the period.
A simple volatility-based framework, applied systematically, continues to outperform broad-market benchmarks with controlled intraday risk.
 Interested in the Full Breakdown?
I’ve prepared a detailed explanation (including logic, examples, and performance profiles):
![]() Strategy Document: Click to Access
Strategy Document: Click to Access
![]() YouTube Deep‑Dive Video:
YouTube Deep‑Dive Video:

![]() WhatsApp (Direct): +91-8928065586
WhatsApp (Direct): +91-8928065586
(Ask me anything or request access details)