1. Research and Background
1.1 What “derivative logic” means in markets
Most trading systems begin with familiar technical indicators — moving averages, RSI, MACD, breakouts — which are ultimately different ways of summarising the same two ingredients: price and volume. The limitation is that many indicators are descriptive (what happened) rather than dynamic (how the move is evolving right now).
A useful shift in thinking is to stop asking only “is price going up or down?” and start asking “how fast is it moving, is that speed increasing or fading, and is participation confirming it?” That’s exactly what derivatives capture.
In calculus, a derivative is a way of measuring how fast something is changing — which maps cleanly to markets when we treat price and volume as time‑series.
-
If price is a function of time , the first derivative is the rate of change of price. In trading language, this is close to “momentum” or velocity — are prices rising or falling, and how fast?
-
The second derivative measures whether that momentum is strengthening or weakening. In physics it’s acceleration; in markets it can be thought of as trend pressure building up (positive acceleration) or trend pressure fading (negative acceleration).
The key intuition is that many profitable market moves are not just about direction, but about changes in direction and changes in intensity. A simple trend filter that only checks “up or down” can miss important information contained in how the trend is evolving.
A parallel idea applies to volume: if is traded volume, then and tell us whether participation is increasing or drying up. When a price move is accompanied by rising participation, it is often more resilient than a move that is happening on thin activity.
Finally, a useful concept in derivative‑based trading is elasticity: not just whether price and volume are moving, but how sensitive price is to volume. A simple way to frame it is:
“How much does price change for a given change in volume?”
When price moves aggressively on very little volume, it can signal fragility (low depth / poor liquidity). When price advances with healthy and expanding participation, the move is more likely to represent real demand.
This is the foundation of the “core derivative logic” used in PDM: combine (1) price velocity, (2) price acceleration, and (3) volume behaviour to detect persistent directional moves early, while filtering out noisy, participation‑poor moves.
1.2 Why derivatives can add an edge over “plain momentum”
Most investors are familiar with momentum signals built from returns (e.g., 3–12 month performance). Classic academic work like Jegadeesh & Titman (1993), “Returns to Buying Winners and Selling Losers” and the broader momentum literature show that winners tend to keep winning, on average.
Derivative logic is a different lens on the same behavioural reality. If momentum is “trend exists”, acceleration is “trend is strengthening.” Two practical takeaways follow:
-
Acceleration can act as an early warning that a trend is becoming tradable. Trends often start slowly and then expand as more participants join. Capturing the change in momentum (acceleration) can help enter earlier than rules that require a long history of already‑strong returns.
-
Deceleration can act as a risk signal. A move can remain positive (price still rising), but if acceleration turns negative persistently, it may reflect exhaustion, distribution, or a shift toward mean reversion.
This approach is consistent with the broader evidence that technical signals can have statistical content when measured and tested carefully. For example, Lo, Mamaysky & Wang (2000), “Foundations of Technical Analysis” formalises technical pattern recognition as a statistical inference problem rather than pure chart lore.
1.3 Why volume matters for robustness
Price signals are vulnerable to noise, especially in single names. Volume and liquidity research supports the idea that participation helps distinguish “real moves” from “fragile moves.”
A few well‑known findings:
-
Lee & Swaminathan (2000), “Price Momentum and Trading Volume”shows that past volume contains information about the magnitude and persistence of momentum.
-
Chordia & Swaminathan (2000), “Trading Volume and Cross‑Autocorrelations in Stock Returns” links volume to lead‑lag effects and information flow.
-
Microstructure models such as Kyle (1985), “Continuous Auctions and Insider Trading”connect volume, liquidity, and price impact — reminding us that the same price move can mean very different things depending on trading depth.
In practice, this motivates two principles:
-
Momentum signals are stronger when participation confirms them.
-
Price sensitivity to volume (elasticity) can be used as a guardrail, so we don’t confuse illiquidity‑driven jumps with genuine demand.
1.4 Why statistics makes a strategy more resilient
Derivative signals are powerful — but they are also noisy, because markets are discrete, jumpy, and influenced by microstructure. Statistical techniques are what turn a “clever idea” into a repeatable signal.
Key ways statistics improves robustness:
-
Normalisation across stocks: One stock’s “big move” is another stock’s “normal day.” Converting raw signals into z‑scores, percentiles, or volatility‑scaled measures makes signals comparable across names.
-
Noise control: Smoothing (rolling windows), robust estimators, and volatility scaling can reduce false positives.
-
Avoiding false discoveries: Systematic research must account for overfitting and data‑mining. Papers like Bailey et al. (2014/2015), “The Probability of Backtest Overfitting” and Harvey, Liu & Zhu (2016), “… and the Cross‑Section of Expected Returns” explain why many “good looking” strategies fail out‑of‑sample when researchers test too many variations.
The practical message is simple: derivative features are raw ingredients — statistical framing is what makes them stable enough to trade.
1.5 Related research: physics analogies and z‑score dynamics
Derivative logic is closely aligned with a family of “physics‑inspired” market models that describe trends in terms of motion, force, and stability.
Recent “physics‑inspired” approaches make this intuition explicit by treating markets like motion: price as a position, momentum as velocity, and changes in momentum as acceleration. One example is Newtonian Mechanics in Financial Markets: Z‑Score Simulation of S&P 500 Momentum (2000–2025), which models log‑price as a displacement series (x(t)=ln P(t)) and studies its first and second derivatives as clean measures of trend and change in trend.
A particularly practical idea in this line of work is standardisation: converting derivative series into z‑scores so that “strong momentum” means something comparable across very different volatility regimes and time periods. In other words, derivative features become more useful when they are not only computed, but also put on a common statistical scale — making them easier to compare, rank, and test.
2. Strategy construction
2.1 Universe selection and data hygiene
We build PDM as a long‑term, systematic equity strategy on Indian stocks using a large liquid universe (anchored on broad‑market constituents such as NIFTY 500). At this stage, the goal is straightforward: focus on stocks that are realistically tradable (liquidity, price sanity, minimum history), apply standard corporate‑action adjustments so the price/volume series are consistent, and keep the overall workflow systematic and repeatable.
2.2 Signal engine: price–volume derivatives as a momentum “pressure gauge”
The signal layer combines three ideas into a single decision framework.
First, we compute price velocity and price acceleration to capture not just direction, but whether the trend is building or fading. Second, we introduce a volume confirmation layer so that the strategy prefers moves supported by rising participation. Third, we use a volume–price sensitivity check (elasticity) to avoid trades where the apparent move is likely dominated by thin liquidity.
Instead of relying on one indicator, the strategy treats these measures as complementary: acceleration tells us whether the move is strengthening, volume tells us whether the move is supported, and elasticity helps us avoid brittle signals.
2.3 Portfolio formation and rebalancing
Once signals are computed, the strategy constructs a ranked list of candidates and builds a diversified basket from the strongest names, with a hard cap on the number of positions so the portfolio remains implementable. Allocation is kept intentionally simple (e.g., equal weight within the selected basket) and the basket is refreshed on a scheduled cadence, so turnover stays controlled.
The design philosophy is: capture meaningful multi‑week to multi‑month moves, not micro‑noise.
2.4 Risk management and exits
Risk controls are embedded at both the position and portfolio level. Stops and exits are volatility‑aware so that the strategy does not treat all stocks as having the same risk. We also enforce diversification and concentration limits so that no single name dominates outcomes.
Importantly, PDM is long‑term in intent: it allows winners time to compound while systematically stepping aside when the derivative‑based “pressure” profile deteriorates.
3. Backtests
All backtests are implemented on Wizzer using point‑in‑time universes/index membership and corporate‑action adjusted data (splits, bonuses, dividends where applicable), so the simulation matches what was actually investable on each date and does not benefit from survivorship or look‑ahead bias. The backtest engine uses clean end‑of‑day price and volume data, applies the same signal and rebalance logic as the live strategy, and includes execution‑side assumptions (fees and transaction costs) to keep results grounded.
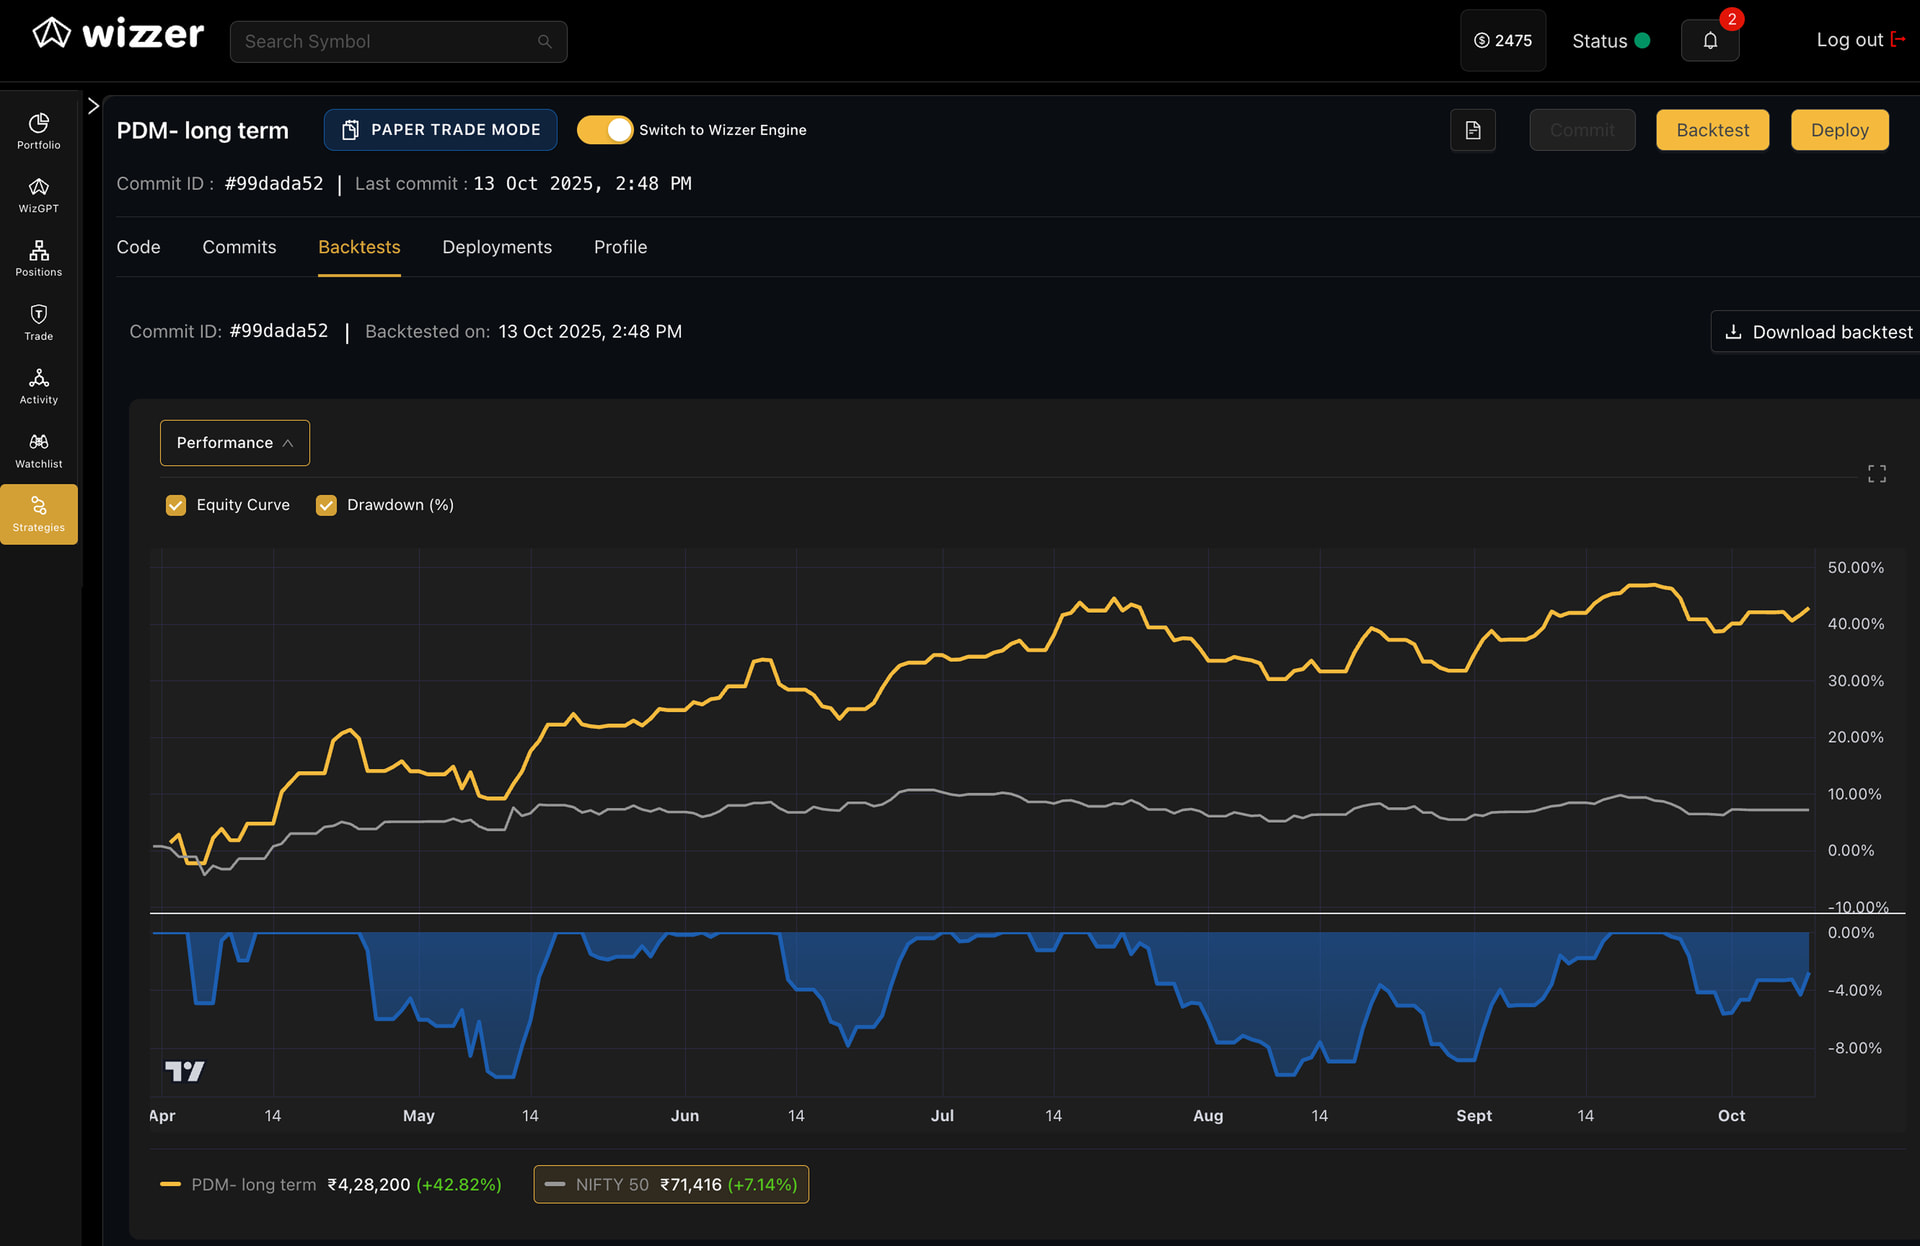
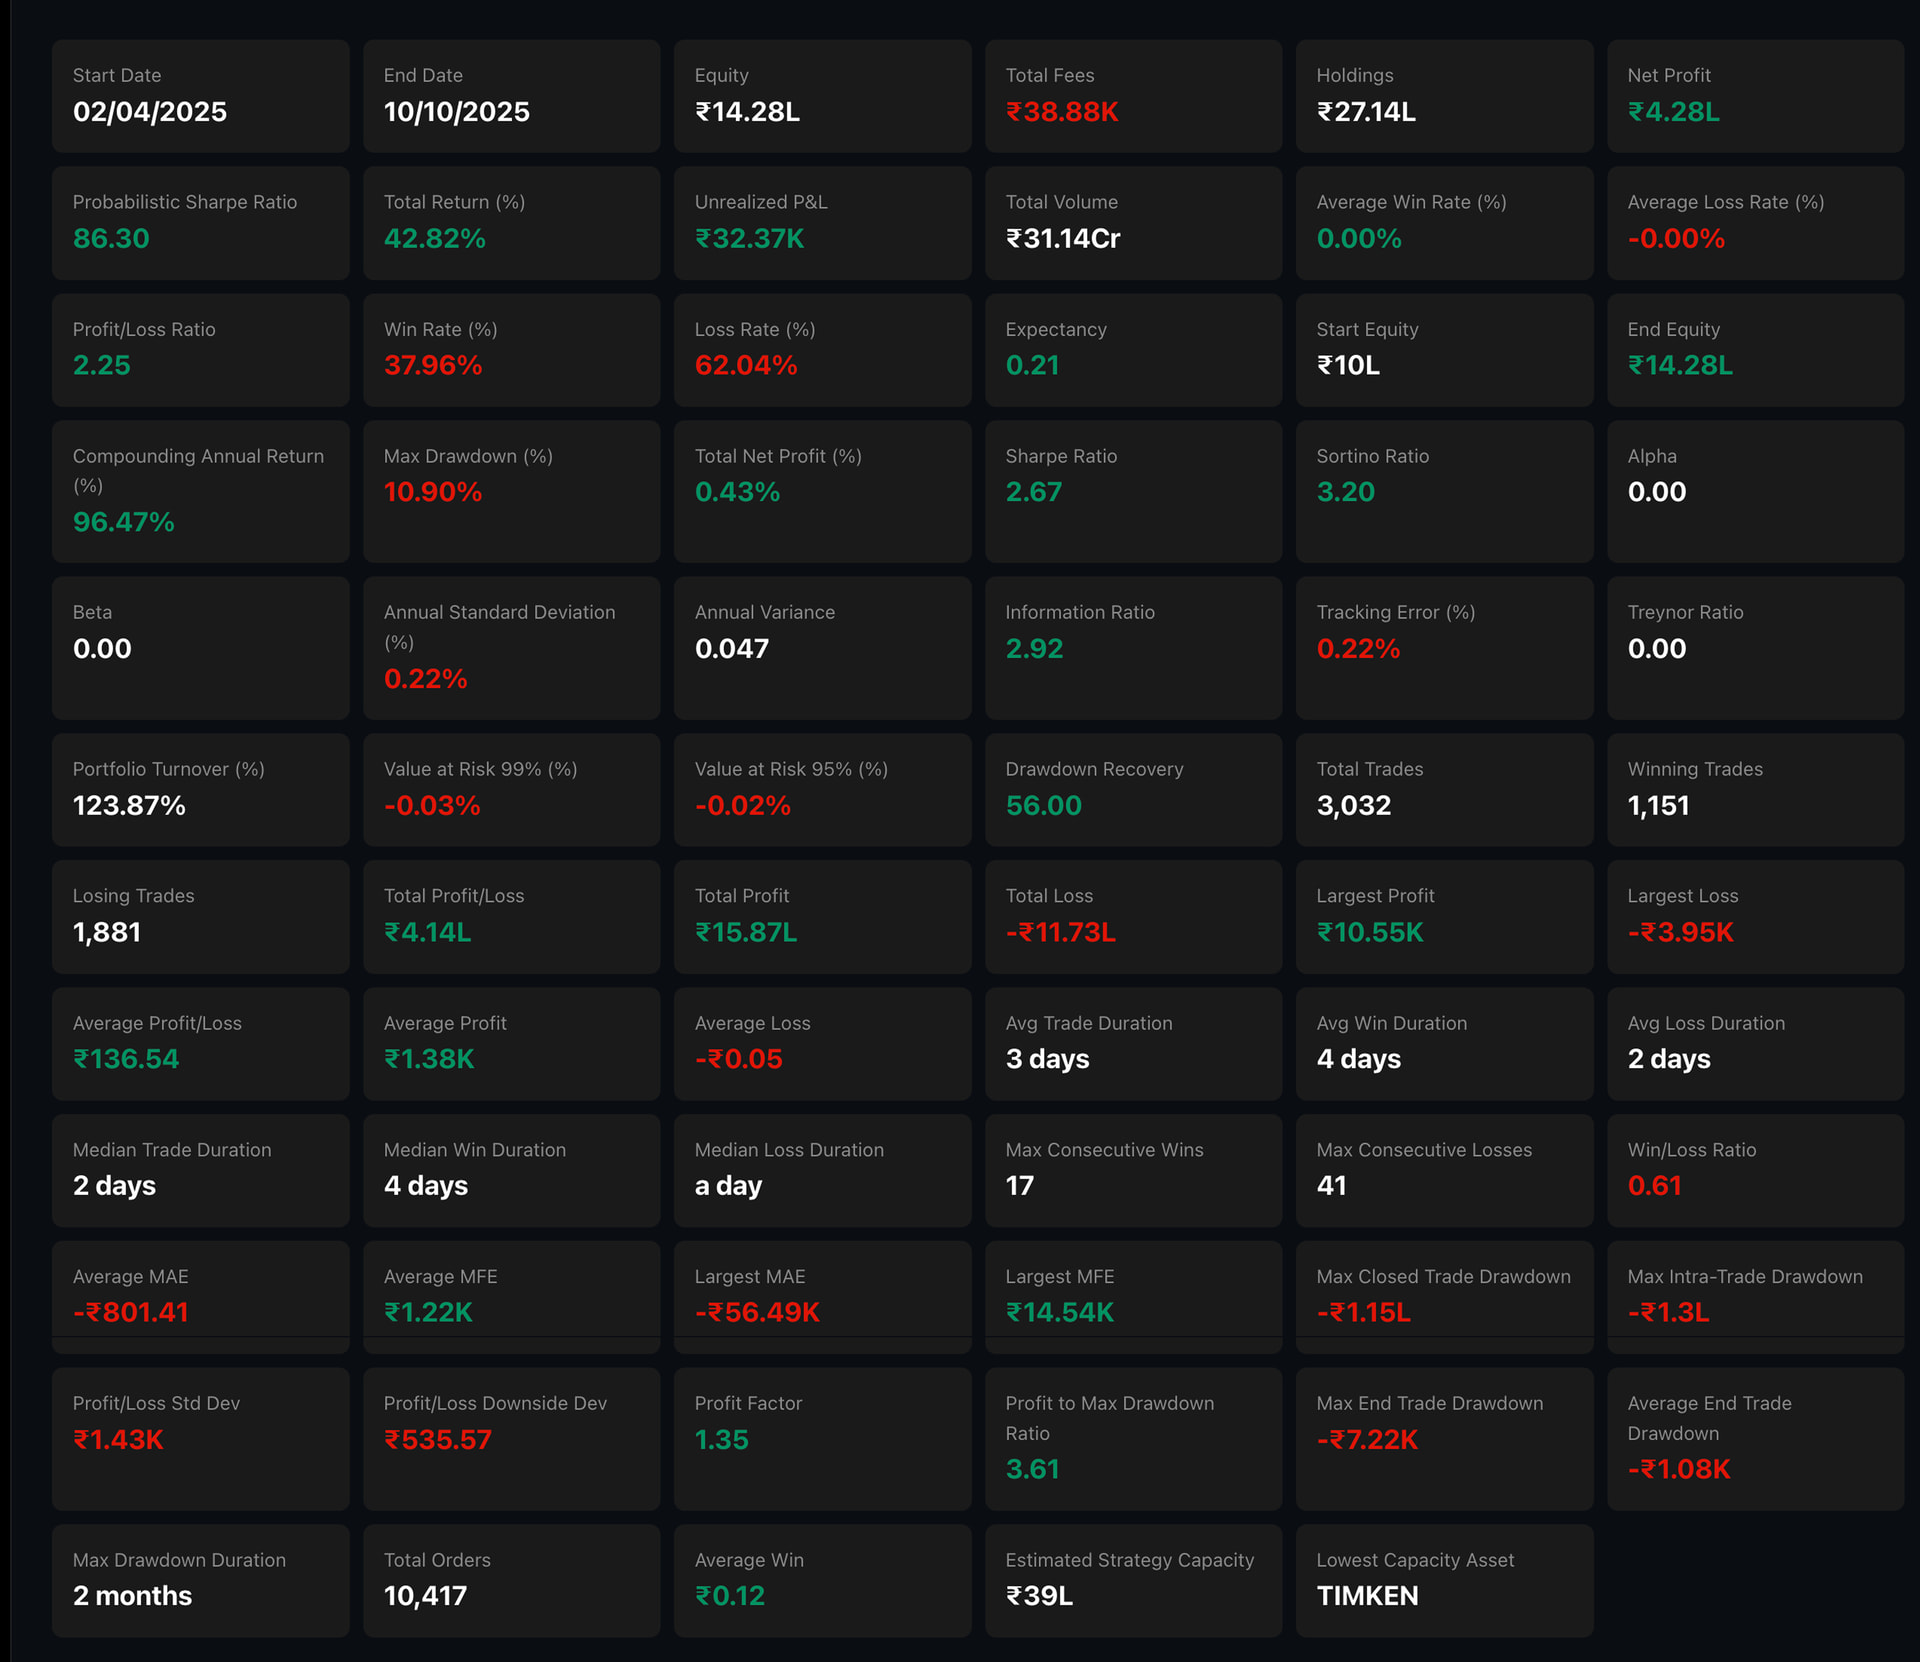
4. Outcomes
This backtest ran from 02 Apr 2025 to 10 Oct 2025. Over this period the strategy delivered a +42.82% total return (net profit ₹4.28L on a ₹10L start), ending at about ₹14.28L. Over the same window, NIFTY 50 was up roughly +7.14%, so the strategy meaningfully outperformed the benchmark.
On a risk‑adjusted basis, the run is also strong: Sharpe ~2.67 and Sortino ~3.20, with a max drawdown ~10.9%. The return profile is consistent with a momentum‑style approach where winners do the heavy lifting: even with a modest hit rate (~38%), the profit/loss ratio ~2.25 indicates that average winners are materially larger than average losers.
Overall, the standout takeaways from this run are the combination of high absolute return, clear benchmark outperformance, and controlled drawdowns for the period tested.
5. References
5.1 Our materials
- Comprehensive Strategy Video (YouTube)

-
Strategy Document
 Click to open
 -
Research Paper Pack (Folder)
Click to open
6. Contact us
If you’d like the full research pack, detailed backtest outputs, or a walkthrough of how we implement PDM systematically on Wizzer, reach us on WhatsApp:
+91-8928065586